


国内外主要通过过时效(T7处理)[9]、回归再时效(retrogression and re-ageing,RRA)[10]和非等温时效(non-isothermal aging,NIA)[11]等方法来提升 Al-Zn-Mg-Cu 合金的晶界腐蚀抗力。但是,由于只关注析出相自身的析出行为和分布特征,而忽略了晶界腐蚀行为的本体,即晶界本身,上述方法并不是求解Al-Zn-Mg-Cu 合金晶界腐蚀问题的最佳途径。事实上,晶界本身的结构与特性是影响晶界析出相析出行为及分布特征的主要因素,着眼于晶界本身的结构与特性[12,13],遵循晶界工程(grain boundary engineering,GBE)[14,15]研究思想,合理调控晶界特征分布(grain boundary character distribution,GBCD)是解决Al-Zn-Mg-Cu 合金晶界腐蚀问题的根本方法。
研究[16]表明,fcc金属中的共格孪晶界是一种奇异晶界(singular boundary,SB),晶界处的原子面被两侧晶粒共享,晶界具有全重位结构特征,不存在析出相,对晶界腐蚀先天“免疫”。但是,Al及其合金虽为fcc结构,但具有高层错能属性,不易在形变及再结晶等组织重构过程中生成SB。本课题组[15,17,18]近年来的相关研究表明,具有密排面与密排面界面匹配(grain boundary inter-connection,GBIC),即具有{111}/{111} GBIC特征的晶界,是一种重位密度高、对析出行为有强烈抑制作用且比SB更容易在组织重构过程中生成的晶界,是Al及其合金中的一类近奇异晶界(near singular boundary,NSB,以下简称{111}/{111}-NSB),调控并提高此类晶界的比例可显著改善铝合金的晶界腐蚀抗力。近期,本课题组[19]在研究轧制变形和再结晶退火对Al-Zn-Mg-Cu 合金{111}/{111}-NSB的影响时发现,连续再结晶(continuous recrystallization,CRX)[20]可促进{111}/{111}-NSB的生成。但是,由于是在300℃轧制变形后,再经520℃加热完成再结晶,其CRX实质上是一种连续静态再结晶(continuous static recrystallization,CSRX)。考虑到合金材料在高温变形时会发生动态再结晶(dynamic recrystallization,DRX)[21],而DRX又可根据其再结晶机制的不同分为不连续DRX (DDRX)和连续DRX (CDRX),有必要在该研究[19]基础上进一步考察Al-Zn-Mg-Cu 合金在DRX、特别是CDRX过程中{111}/{111}-NSB的生成行为,以期为合理调控{111}/{111}-NSB并进一步提高其比例提供重要理论和实验依据。
1 实验方法
1.1 材料及高温压缩实验
选用国产 7A85 (Al-Zn-Mg-Cu) 铝合金热轧板作为实验原料,合金成分(质量分数,%)为:Zn 7.79,Mg 1.53,Cu 1.68, Ti 0.04,Fe 0.04,Si 0.02,Cr 0.01,Mn 0.01,Zr 0.093,Al余量。从母材切下长、宽、厚分别为30、15和15 mm的样品,经470℃、12 h和520℃、6 h双级固溶处理[22]后,进行厚度减缩量为30%的室温单向轧制和530℃、10 min的再结晶退火,以此获得初始样品。初始样品具备等轴化较好的晶粒组织,平均晶粒尺寸约为60 μm。采用BeaulerMC-5000精密切割机切取多个长、宽、高分别为5、5和10 mm的样品,利用INSTRON LEGEND 2382万能材料试验机对3个平行样品分别在450、480和520℃沿高度方向压缩70%,对应真应变为1.20,压缩时的应变速率均为0.001 s-1,压缩后的样品立即水淬冷却至室温。为方便表述,将上述3个压缩样品命名为试样A~C。压缩过程中块体样品的体积保持不变,样品厚度减小的同时,受压面积不断增大,由实时记录的载荷-应变曲线可以获得应力-应变曲线。
1.2 EBSD测试及{111}/{111}-NSB表征
使用金相砂纸对压缩后的样品由粗至细进行机械打磨抛光,然后用HClO4∶C2H5OH = 1∶9 (体积比)的抛光液电解抛光3 min,抛光电压维持在20 V,电流在0.5~1.0 A之间。将电解抛光后的样品经 EM TIC 3X离子抛光2 h,离子抛光电压为5 kV,抛光过程中样品的温度控制在50℃以内。经离子抛光好的样品立即进行电子背散射衍射(electron backscatter diffraction,EBSD)测试,或保存在真空干燥箱中备用。
采用Nova nano 450场发射扫描电子显微镜 (FE-SEM)配备的HKL-NordlysMax2 附件对离子抛光后的样品进行EBSD测试。设定EBSD工作参数为:加速电压20 kV、工作距离12 mm、扫描步长3 μm、测试区域尺寸1200 μm × 1200 μm。为了保证统计结果具有代表性,每个样品均测试多个区域,确保测定的晶界数量多于5.0 × 10⁴条。
利用Oxford Aztec专用软件Manager对测得的EBSD 原始数据进行处理,根据实际需要生成取向成像显微(orientation imaging microscopy,OIM)像、晶界网络(grain boundary network,GBN)图、晶界取向差分布(misorientation distribution,MD)图和局域平均取向差分布(kernel average misorientation,KAM)图等。同时,将EBSD原始数据进行必要格式转换后,导入EDAX TSL-OIM8.0软件系统完成晶界重构,并将重构后的晶界数据以文本格式输出。依据其取向差<uvw>/θ特征(其中,<uvw>为旋转轴,θ为旋转角),采用自编软件对重构后的晶界进行旋转轴/旋转角过滤,即先进行轴过滤,再进行角过滤,简称“轴/角”过滤。考虑到DRX,特别是CDRX过程中会生成较多小角度晶界(low angle grain boundary,LAGB)[23],而LAGB中也可能存在{111}/{111}-NSB,因此,本工作在进行轴过滤时,特别过滤了以8个低Miller指数晶轴<001>、<011>、<012>、<013>、<111>、<112>、<113>和<122>为旋转轴的所有晶界,这与前期工作[19]中只考虑大角度晶界(high angle grain boundary,HAGB)中的{111}/{111}-NSB,且仅过滤以<111>、<112>和<122> 3个晶轴为旋转轴的晶界有所不同。对轴过滤后的每一组具有固定旋转轴的晶界再进行角过滤,角过滤始于5°,止于60°,设定角度偏差为±2.5°,每隔5°过滤一次。经过轴/角过滤,重构后的晶界被分成若干组,每组晶界都有各自固定的取向差<uvw>/θ。
采用Rohrer等[24]和Saylor等[25]的基于体视学及统计学的五参数分析(five parameter analysis,FPA)法,对轴/角过滤后的每一组具有各自固定取向差晶界的晶界面分布(grain boundary plane distribution,GBPD)[26]进行统计,并投影在(001)内,其中GBPD强度以随机分布强度的倍数(multiples of random distribution,MRD)表示。利用前期工作[27,28]给出的GBIC定量计算公式,计算每一组晶界(i)中{111}/{111}-NSB占总晶界的比例(Fi,长度分数),对所有Fi 求和,可得到每个样品中{111}/{111}-NSB占总晶界的比例F。有关GBIC定量计算的详细过程可参阅文献[27,28]。
采用Wright和Larsen[29]的{111}重叠极图迹线分析法对个别晶界是否为{111}/{111}-NSB进行分析。按照该方法,当OIM图中某一晶界迹线的法线穿过该晶界两侧2个晶粒的{111}重叠极图中重合的2个{111}极点时,可判定该晶界为{111}/{111}-NSB。
2 实验结果
2.1 高温压缩变形后的显微组织
图1是Al-Zn-Mg-Cu 合金A、B和C样品的EBSD结果。可以看出,3个样品的晶粒组织不均匀,存在间隔分布的粗晶区和细晶区(图1a、d和g中黑色虚线椭圆框定的区域为细晶区)。粗晶区的平均晶粒尺寸为60~70 μm (图1b、e和h中红色虚线椭圆框定的区域),细晶区的平均晶粒尺寸为10~20 μm (图1b、e和h中绿色虚线椭圆框定的区域以及粉色虚线框定区域的放大图1c、f和i)。3个样品显微组织的明显不同之处有2点:一是A样品细晶聚集成细条带状的特征比较明显(图1b中红色箭头所指处),B和C样品的该特征不明显;二是A样品的粗晶区区域较小,而B和C样品的粗晶区区域较大(图1b、e和h中红色虚线椭圆框定的区域)。图2是3个样品经晶界重构获得的所有晶界的MD图。可以看到,3个样品的取向差分布特征基本一致,均为LAGB居多,且在旋转角为8°附近存在峰值。
图1
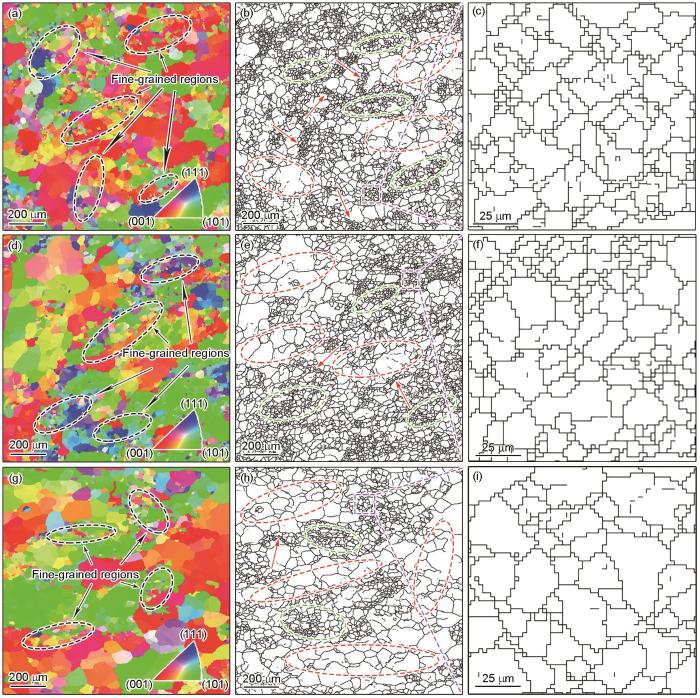
图1
分别经450、480和520℃压缩的A~C样品的取向成像显微(OIM)像、晶界网络(GBN)图以及局部细晶组织放大图
Fig.1
Orientation imaging microscopy (OIM) images (a, d, g), grain boundary network (GBN) maps (b, e, h), and the magnifications of the fine-grained regions as marked by the squares in Figs.1b, e, and h (c, f, i) for the samples A (a-c), B (d-f), and C (g-i) compressed at 450, 480, and 520oC, respectively (In Figs.1b, e, and h, red arrows point at the fine grains aggregated at the initial grain boundaries; the areas framed by the red dotted lines are the coarse-grained regions, the areas framed by the green dotted lines are the fine-grained regions)
图2

图2
A~C样品重构出的晶界取向差分布(MD)图
Fig.2
Misorientation distribution (MD) maps of the reconstructed grain boundaries in the samples A (a), B (b), and C (c)
2.2 高温压缩变形后的{111}/{111}-NSB
450、480和520℃高温压缩变形后的A、B和C样品,经EBSD测试和相关数据处理,分别重构出了53165、55312和52726条晶界。通过轴过滤,3个样品中旋转轴为<001>、<011>、<012>、<013>、<111>、<112>、<113>和<122>的晶界数量(NB)、长度分数(LF)和数量分数(NF)汇总于表1。由表1可见,尽管具有不同旋转轴的晶界数量及其比例各不相同,但3个样品中基于上述8个旋转轴过滤出的总的晶界占重构出来的晶界的比例(LF或NF)均接近或超过了70%。进一步经角过滤后,3个样品中以上述8个晶轴为旋转轴的晶界的取向差分布如图3所示。可以看到,具有不同旋转轴的晶界,其取向差分布特征基本一致,均是旋转角小于15°的LAGB居多,且均在旋转角为8°附近出现峰值,这与图2的结果一致。显然,这与课题组前期工作[19]明显不同,本工作需要重点关注LAGB中的{111}/{111}-NSB。
表1 A~C样品经8个低Miller指数旋转轴过滤出的晶界数量及其比例统计
Table 1
| Sample | Rotation axis | NB | LF / % | NF / % |
|---|---|---|---|---|
| A | <001> | 1340 | 2.50 | 2.52 |
| <011> | 3450 | 5.72 | 6.49 | |
| <012> | 5593 | 10.20 | 10.52 | |
| <013> | 5332 | 9.96 | 10.03 | |
| <111> | 2594 | 4.92 | 4.88 | |
| <112> | 6443 | 12.07 | 12.12 | |
| <113> | 5545 | 10.59 | 10.43 | |
| <122> | 7432 | 14.10 | 13.98 | |
| B | <001> | 1349 | 2.40 | 2.44 |
| <011> | 3385 | 6.07 | 6.12 | |
| <012> | 5620 | 10.08 | 10.16 | |
| <013> | 5636 | 10.24 | 10.19 | |
| <111> | 2804 | 5.03 | 5.07 | |
| <112> | 6682 | 12.28 | 12.08 | |
| <113> | 5846 | 10.58 | 10.57 | |
| <122> | 7710 | 14.04 | 13.94 | |
| C | <001> | 1371 | 2.73 | 2.60 |
| <011> | 3316 | 6.30 | 6.29 | |
| <012> | 5484 | 10.21 | 10.40 | |
| <013> | 5299 | 9.99 | 10.05 | |
| <111> | 2573 | 4.79 | 4.88 | |
| <112> | 6306 | 12.06 | 11.96 | |
| <113> | 5505 | 10.59 | 10.44 | |
| <122> | 7318 | 13.83 | 13.88 |
图3
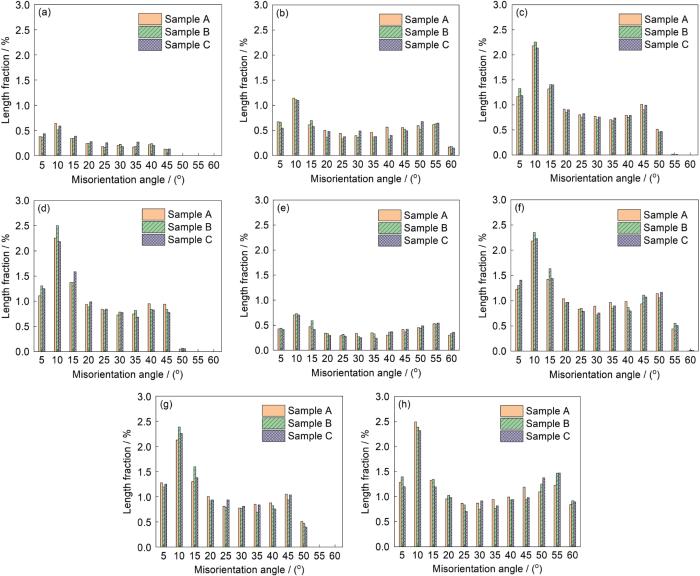
图3
A~C样品具有特定旋转轴晶界的MD图
Fig.3
MD maps of grain boundaries with specific rotation axis for the samples A-C
(a) rotation around <001> (b) rotation around <011> (c) rotation around <012>
(d) rotation around <013> (e) rotation around <111> (f) rotation around <112>
(g) rotation around <113> (h) rotation around <122>
对轴/角过滤得到的具有各自固定取向差的每组晶界进行FPA统计后,可得到其GBPD;对任意一组晶界GBPD的分布强点和次强点进行有关矩阵运算[15],可确定该组晶界是否存在{111}/{111}-NSB。图4和5分别给出经520℃压缩的C样品中LAGB和HAGB中存在{111}/{111}-NSB的每组晶界的GBPD,从中可以确定每组晶界(i)中{111}/{111}-NSB的分布强度(Mi );从图3中可得到每组晶界占总晶界的比例(Pi );从每组晶界的加权平均取向差Gauss分布曲线[27]中可获得其半高宽(FWHM),即Wi。为方便理解,图6给出了样品C中存在{111}/{111}-NSB的一组LAGB和一组HAGB的加权平均取向差Gauss分布曲线,其Wi 分别为1.80和1.95。将得到的Mi 、Pi 和Wi 代入GBIC定量计算公式[27,28],可得到每组晶界中{111}/{111}-NSB占总晶界的比例Fi。对另外2个样品进行相同统计和计算,可得到每组晶界中的Fi;对每个样品的Fi 求和,便得到各样品中{111}/{111}-NSB占总晶界的比例F。各样品中的Fi 和F计算结果及其关联Mi 、Pi 和 Wi 各值按LAGB和HAGB 2个类别分别汇总在表2和3中。为直观对比,图7给出了LAGB和HAGB中{111}/{111}-NSB占总晶界比例随压缩温度的变化规律。
图4
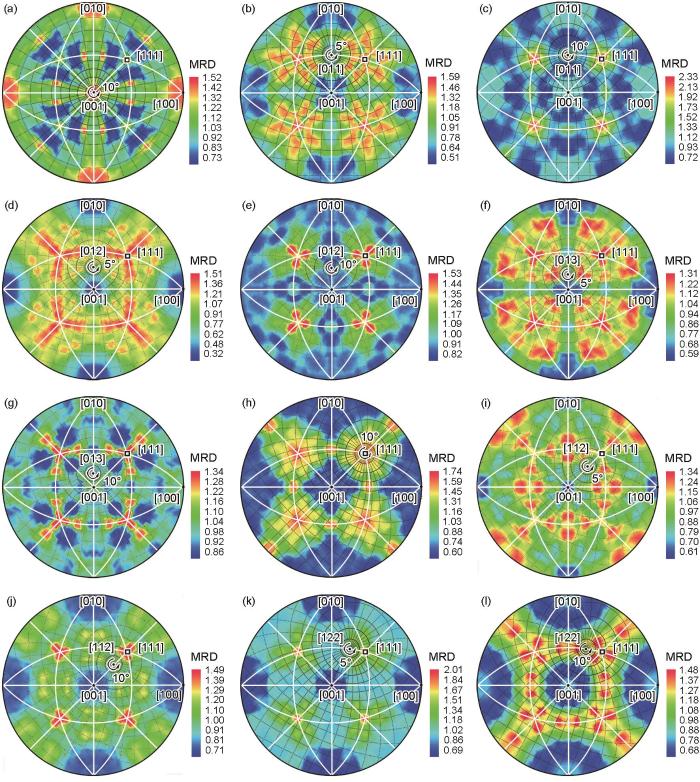
图4
C样品小角度晶界(LAGB)中存在{111}/{111}近奇异晶界({111}/{111}-NSB)的各组晶界五参数晶界面分布图(投影在(001)内)
Fig.4
Five parameter grain boundary plane distributions of the low-angle grain boundary (LAGB) groups containing {111}/{111} near singular boundaries ({111}/{111}-NSB) in the sample C (A projection onto (001); MRD—multiple of random distribution)
(a) <00>/10° (b) <011>/5° (c) <011>/10° (d) <012>/5° (e) <012>/10° (f) <013>/5°
(g) <013>/10° (h) <111>/10° (i) <112>/5° (j) <112>/10° (k) <122>/5° (l) <122>/10°
图5
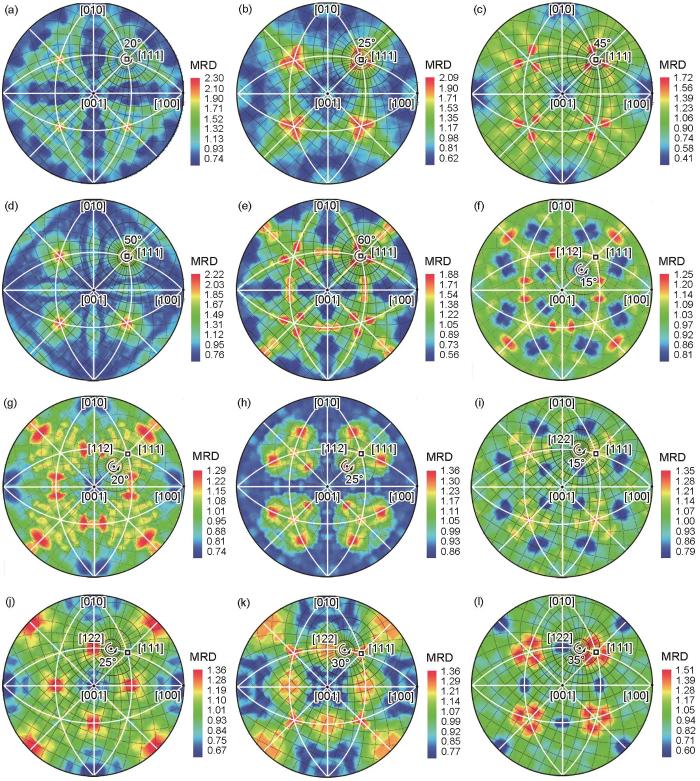
图5
C样品大角度晶界(HAGB)中存在{111}/{111}-NSB的各组晶界五参数晶界面分布图(投影在(001)内)
Fig.5
Five parameter grain boundary plane distributions of the high-angle grain boundary (HAGB) groups containing {111}/{111}-NSB in the sample C (A projection onto (001))
(a) <111>/20° (b) <111>/25° (c) <111>/45° (d) <111>/50° (e) <111>/60° (f) <112>/15°
(g) <112>/20° (h) <112>/25° (i) <122>/15° (j) <122>/25° (k) <122>/30° (l) <122>/35°
图6
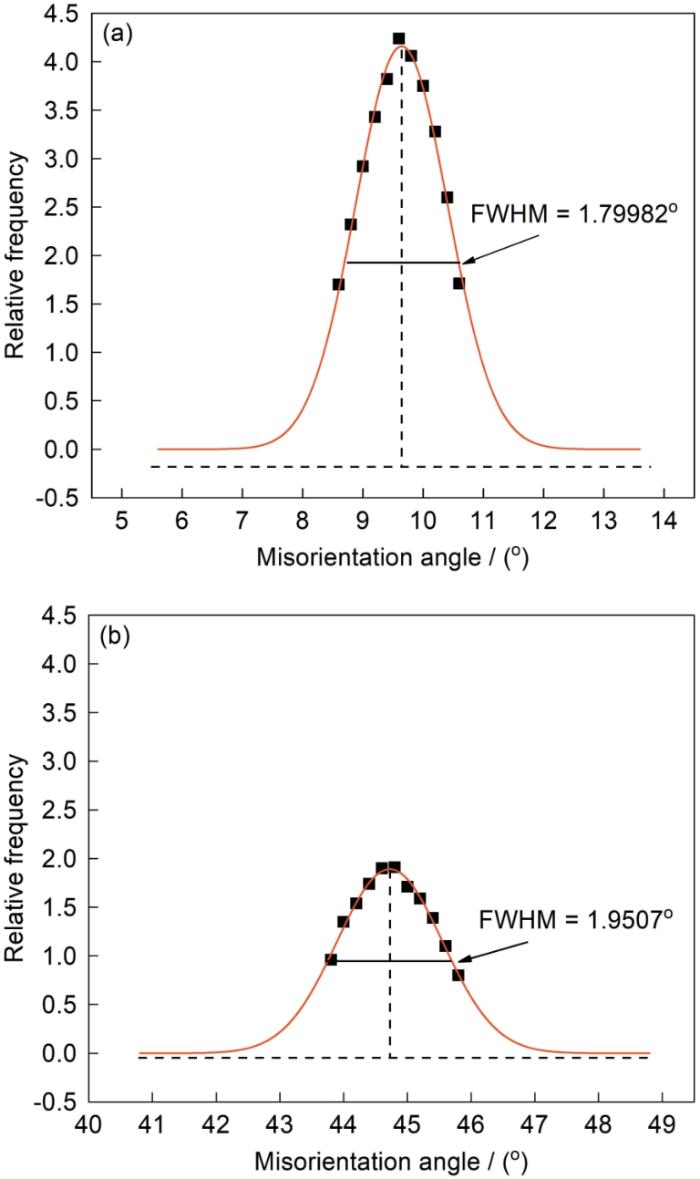
图6
C样品中存在{111}/{111}-NSB的2组晶界的加权平均取向差Gauss分布曲线
Fig.6
Weighted Gaussian misorientation distribution curves of two grain boundary groups containing {111}/{111}-NSBs in the sample C (FWHM—full width half maximum)
(a) <111>/10° (b) <111>/45°
表2 A~C样品LAGB中的{111}/{111}-NSB定量计算
Table 2
| Sample | Misorientation <uvw>/θ | Pi % | Mi | Wi (°) | Fi % | F % |
|---|---|---|---|---|---|---|
| A | <012>/5° | 1.16 | 1.90 | 1.70 | 0.62 | 4.18 |
| <013>/5° | 1.11 | 1.64 | 2.01 | 0.58 | ||
| <111>/5° | 0.42 | 1.86 | 2.13 | 0.22 | ||
| <111>/10° | 0.71 | 1.85 | 2.09 | 0.37 | ||
| <113>/10° | 2.13 | 1.32 | 1.83 | 1.11 | ||
| <122>/10° | 2.49 | 1.37 | 2.11 | 1.28 | ||
| B | <011>/5° | 0.66 | 1.69 | 1.94 | 0.35 | 4.87 |
| <011>/10° | 1.11 | 1.43 | 2.00 | 0.58 | ||
| <112>/5° | 1.33 | 1.55 | 2.17 | 0.69 | ||
| <013>/5° | 1.31 | 1.30 | 1.78 | 0.68 | ||
| <111>/5° | 0.44 | 1.85 | 1.82 | 0.23 | ||
| <111>/10° | 0.73 | 1.61 | 2.29 | 0.38 | ||
| <122>/5° | 1.40 | 1.44 | 1.98 | 0.72 | ||
| <122>/10° | 2.39 | 1.57 | 2.12 | 1.24 | ||
| C | <001>/10° | 0.59 | 1.52 | 1.85 | 0.31 | 8.77 |
| <011>/5° | 0.54 | 1.59 | 1.69 | 0.29 | ||
| <011>/10° | 1.09 | 2.33 | 1.80 | 0.59 | ||
| <012>/5° | 1.18 | 1.51 | 2.01 | 0.61 | ||
| <012>/10° | 2.14 | 1.53 | 1.90 | 1.11 | ||
| <013>/5° | 1.25 | 1.31 | 2.26 | 0.64 | ||
| <013>/10° | 2.18 | 1.34 | 2.08 | 1.12 | ||
| <111>/10° | 0.71 | 1.74 | 1.80 | 0.37 | ||
| <112>/5° | 1.41 | 1.34 | 1.84 | 0.73 | ||
| <112>/10° | 2.23 | 1.49 | 2.10 | 1.15 | ||
| <122>/5° | 1.20 | 2.01 | 1.40 | 0.65 | ||
| <122>/10° | 2.32 | 1.48 | 2.02 | 1.20 |
图7
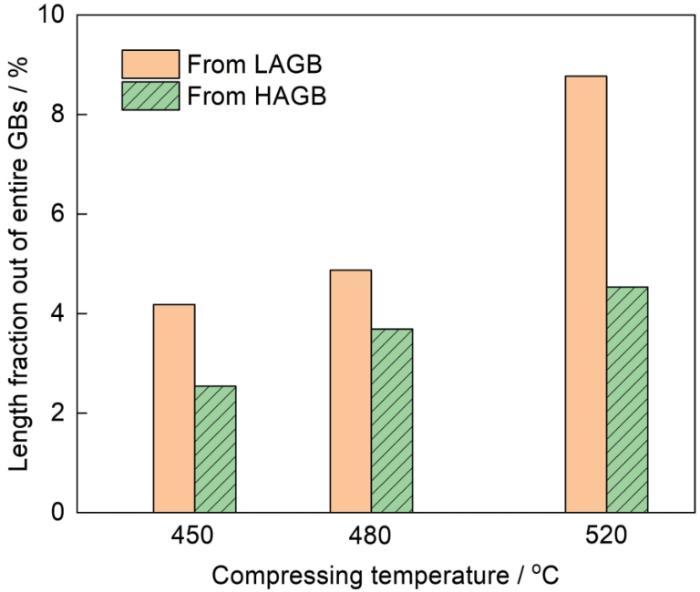
图7
A~C样品中LAGB和HAGB中的{111}/{111}-NSB比例
Fig.7
Relative frequency of {111}/{111}-NSB from the LAGB and HAGB in samples A-C
| (a) <001>/10° | (b) <011>/5° | (c) <011>/10° | (d) <012>/5° | (e) <012>/10° | (f) <013>/5° |
| (g) <013>/10° | (h) <111>/10° | (i) <112>/5° | (j) <112>/10° | (k) <122>/5° | (l) <122>/10° |
表3 A~C样品HAGB中的{111}/{111}-NSB定量计算
Table 3
| Sample | Misorientation <uvw>/θ | Pi % | Mi | Wi (°) | Fi % | F % |
|---|---|---|---|---|---|---|
| A | <111>/15° | 0.47 | 2.27 | 2.25 | 0.25 | 2.54 |
| <111>/20° | 0.34 | 1.98 | 1.79 | 0.18 | ||
| <111>/35° | 0.34 | 2.06 | 1.65 | 0.19 | ||
| <111>/40° | 0.30 | 1.32 | 2.05 | 0.16 | ||
| <111>/45° | 0.41 | 1.40 | 1.77 | 0.21 | ||
| <112>/20° | 1.04 | 1.42 | 1.88 | 0.54 | ||
| <122>/20° | 0.96 | 1.57 | 2.05 | 0.50 | ||
| <122>/40° | 0.99 | 1.24 | 2.15 | 0.51 | ||
| B | <111>/25° | 0.32 | 2.40 | 2.33 | 0.17 | 3.69 |
| <111>/30° | 0.27 | 1.55 | 1.44 | 0.14 | ||
| <111>/35° | 0.33 | 1.74 | 1.87 | 0.17 | ||
| <111>/40° | 0.36 | 1.53 | 1.57 | 0.19 | ||
| <111>/50° | 0.87 | 1.45 | 1.89 | 0.23 | ||
| <111>/55° | 0.52 | 2.35 | 2.07 | 0.28 | ||
| <112>/15° | 1.60 | 1.30 | 2.01 | 0.84 | ||
| <1 2>/25° | 0.84 | 1.22 | 2.06 | 0.43 | ||
| <112>/30° | 0.72 | 1.62 | 2.07 | 0.37 | ||
| <122>/35° | 0.77 | 1.25 | 2.06 | 0.39 | ||
| <122>/40° | 0.93 | 1.46 | 2.02 | 0.48 | ||
| C | <111>/20° | 0.30 | 2.30 | 1.96 | 0.16 | 4.53 |
| <111>/25° | 0.28 | 2.09 | 1.72 | 0.15 | ||
| <111>/45° | 0.42 | 1.72 | 1.95 | 0.22 | ||
| <111>/50° | 0.49 | 2.22 | 1.73 | 0.26 | ||
| <111>/60° | 0.36 | 1.88 | 2.17 | 0.19 | ||
| <112>/15° | 1.44 | 1.25 | 2.07 | 0.74 | ||
| <112>/20° | 0.97 | 1.29 | 2.09 | 0.50 | ||
| <112>/25° | 0.79 | 1.36 | 2.07 | 0.41 | ||
| <122>/15° | 1.20 | 1.35 | 2.04 | 0.62 | ||
| <122>/25° | 0.71 | 1.36 | 1.87 | 0.37 | ||
| <122>/30° | 0.92 | 1.36 | 1.74 | 0.48 | ||
| <122>/35° | 0.82 | 1.51 | 1.91 | 0.43 |
3 分析讨论
分别经450、480和520℃压缩的A、B和C样品的载荷-位移曲线和应力-应变曲线如图8所示。可以看出,流变应力在压缩的初期阶段迅速上升,对应的应变区间为0~0.05 (图8b中的ab区间),这是所谓的加工硬化阶段,因压缩温度很高,所以屈服应力很低,介于7~11 MPa之间。继续压缩,合金进入稳态流变阶段,流变应力基本保持恒定,不随应变的增加而增大,其对应的应变区间为0.05~0.70 (图8b中的bc区间)。一般认为[30],稳态流变阶段是加工硬化(应变引入的位错等缺陷导致)与动态软化达到平衡的阶段,而动态软化又包括热激活导致的位错偶对消、位错胞壁锋锐规整化和多边形化等形成亚晶的动态回复过程以及亚晶转动和亚晶合并的DRX过程等等。考虑到本工作选择的压缩温度远高于轧制变形时的动态再结晶温度,认为在稳态流变阶段,动态软化应以DRX为主。为了确认这一点,特别制备了一个中间样品,该样品在450℃以相同应变速率(0.001 s-1)压缩变形至稳态流变中段,对应应变为0.36。从其压缩面和横切面的显微组织(图9)可见,中间样品的晶粒形状具有等轴特征,特别是横切面内的晶粒亦为等轴状,未见因压缩变形呈扁平或条带状特征且仍处于回复阶段的晶粒组织,表明经450℃压缩到达稳态流变的确是一个以DRX为主的阶段。显然,与A样品相比,经480和520℃压缩的B和C样品,其稳态流变阶段流变应力明显偏低的原因应与后者压缩温度更高、DRX更加充分有关。当应变达到0.7时,流变应力开始升高,并且,随着应变的持续增加,流变应力急剧升高,特别是经450℃压缩的A样品,当压缩结束,应变达到1.2时,流变应力几乎增加了一倍,把这一阶段称为二次硬化阶段,对应的应变区间为0.7~1.2 (图8b中的cd区间)。对比考察图9和1的显微组织可见,当应变超过0.7时,稳态流变阶段经DRX生成的较为粗大的晶粒组织开始细化,并且当压缩结束,也就是应变达到1.2时,出现了大量的平均晶粒尺寸为10~20 μm的细晶区(图1b、c、e、f、h、i)。依据Hall-Petch关系,平均晶粒尺寸越小,则流变应力越大,这是二次硬化的原因。由于细晶区内的晶粒均为等轴状,没有因变形而形成的条带状特征,并且细晶区内的KAM表现为清晰的晶界锐化,不存在从晶界到晶内呈梯度分布的KAM (图10),认为细晶区也是一种再结晶组织,也是通过DRX形成的。为方便理解,把稳态流变阶段的DRX称为初次DRX,二次硬化阶段的DRX称为二次DRX。当然,初次DRX与二次DRX并不存在绝对时空界线,例如在稳态流变阶段,也能观察到个别微区的晶粒开始细化(图9b红色圆圈区域),呈现二次DRX特征,因此,可以认为,稳态流变阶段以初次DRX为主;二次硬化阶段以二次DRX为主。
图8
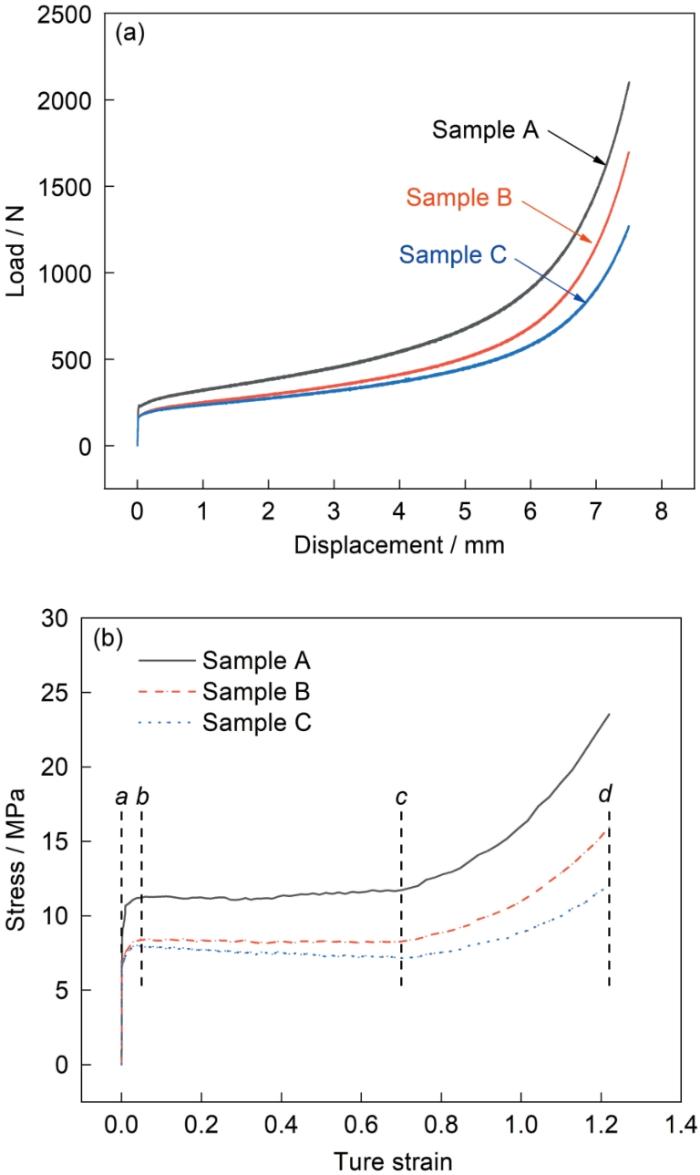
图8
A~C样品的载荷-位移曲线和应力-应变曲线
Fig.8
Load-displacement (a) and stress-strain (b) curves of samples A-C
图9
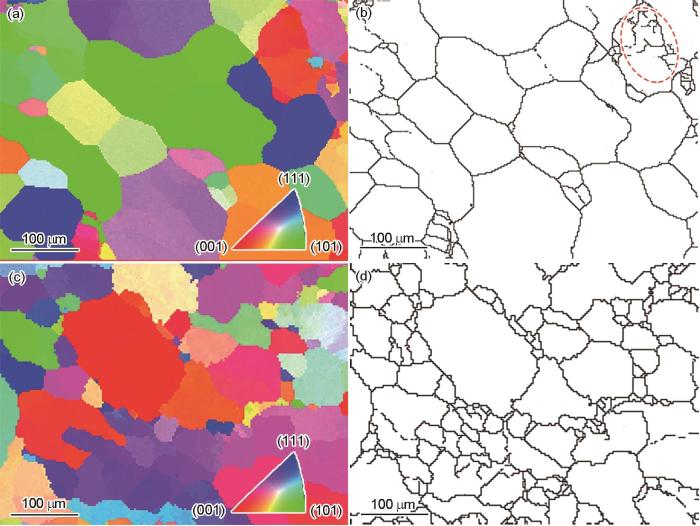
图9
经450℃、应变速率0.001 s-1和应变0.36压缩变形Al-Zn-Mg-Cu合金压缩面与横切面的OIM像与GBN图
Fig.9
OIM images (a, c) and GBN maps (b, d) of the Al-Zn-Mg-Cu alloy compressed at 450oC with a strain rate 0.001 s-1 and true strain 0.36 (The area framed by the red dotted line in Fig.9b is the region where grains begin to refine)
(a, b) compression plane (c, d) cross section
图10
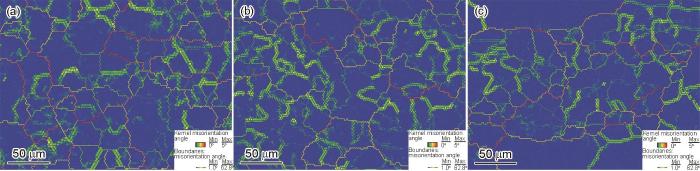
图10
A~C样品细晶区的局域平均取向差分布(KAM)图
Fig.10
Kernel average misorientations (KAM) maps of fine-grained regions in samples A (a), B (b), and C (c)
为了更好地理解初次DRX和二次DRX的行为特点以及粗晶组织和细晶组织中{111}/{111}-NSB比例随压缩温度的变化规律,有必要对450、480和520℃压缩的A、B和C样品中各类晶界的空间分布特征做进一步分析。图11给出了A~C样品的HAGB和不同旋转角LAGB的空间分布GBN图。可以看到,3个样品的粗晶区以HAGB为主,而细晶区则以LAGB为主。由于细晶区占据面积较大且其内LAGB密集分布,导致各样品总体LAGB居多,这与图2给出的结果一致。由于粗晶区主要是在稳态流变阶段通过初次DRX形成的,对应应变较小,在0.7以下,因此初次DRX以DDRX[31]为主,这是粗晶区HAGB居多的原因。相反,细晶区主要是在二次硬化阶段通过二次DRX形成的,按照Humpherys和Hatherly[32]以及Zhang等[33,34]的观点,本工作采用450~520℃高温、0.001 s-1低应变速率和1.2大应变压缩的样品,其对应的DRX、即二次DRX应以CDRX为主。由于CDRX是一个通过亚晶界持续吸收位错,引起亚晶转动和亚晶合并,并形成LAGB的过程,因此,以CDRX为主的二次DRX形成的细晶界区以LAGB为主。此外,fcc金属的主滑移系统为{111}<01
图11
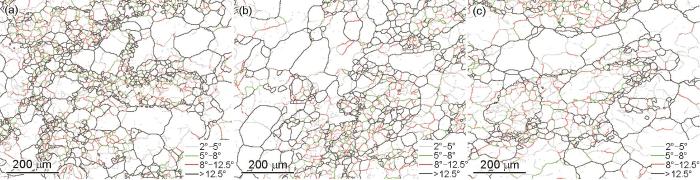
图11
A~C样品中HAGB和不同旋转角LAGB的空间分布GBN图
Fig.11
GBN maps of HAGB and LAGB with different rotation angles in samples A (a), B (b), and C (c)
图12
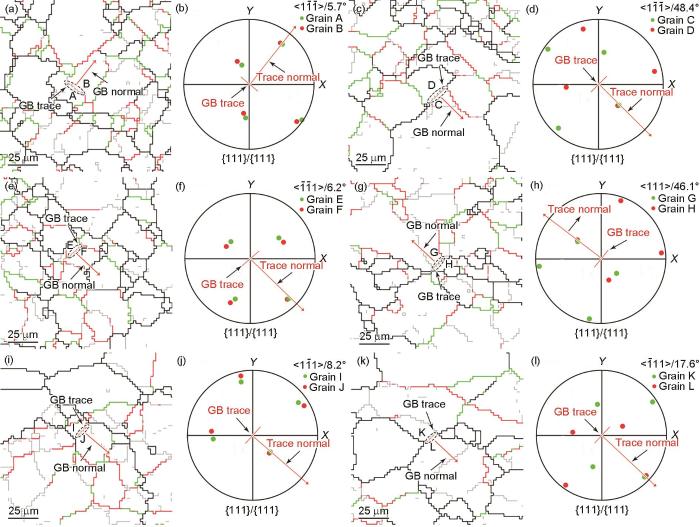
图12
A~C样品LAGB与HAGB中的{111}/{111}-NSB {111}重叠极图迹线分析
Fig.12
Overlapped {111} pole figure trace analyses for the {111}/{111}-NSBs from the LAGB and HAGB in samples A (a-d), B (e-h), and C (i-l)
(a, b) <1
(g, h) <111>/46.1° (i, j) <1
基于上述分析可见,不管是针对LAGB还是HAGB,二次DRX中的CDRX行为对{111}/{111}-NSB的形成有积极影响。按照Zhang等[33]的分析,当应变达到1.2及以上时,二次DRX组织中CDRX的面积分数ƒCDRX和DDRX的面积分数ƒDDRX分别如下:
图13

图13
铝合金压缩变形连续动态再结晶(CDRX)以及不连续动态再结晶(DDRX)面积分数随压缩温度的变化
Fig.13
Area fractions of continuous dynamic recrystallization (CDRX) (ƒCDRX) and discontinuous dynamic recrystallization (DDRX) (ƒDDRX) versus compressing temperatures for Al alloys (Compressed with a strain rate 0.001 s-1 and true strain 1.2)
图14
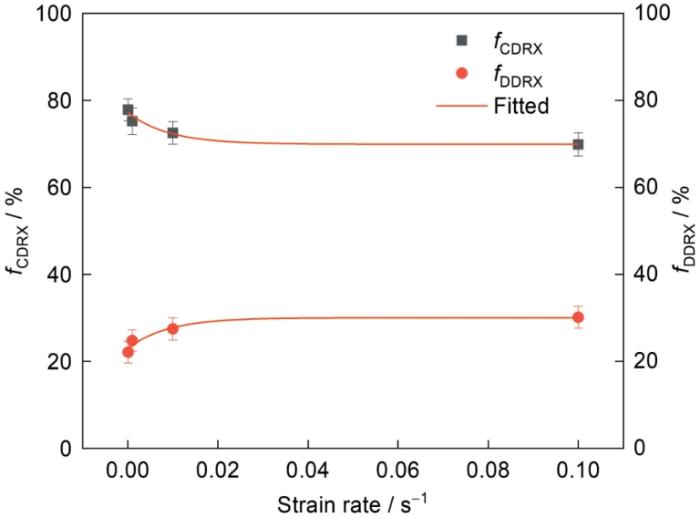
图14
铝合金压缩变形CDRX及DDRX面积分数随压缩应变速率的变化
Fig.14
Area fractions of CDRX and DDRX versus compressing strain rate for Al alloys (Compressed at 520oC with true strain 1.2)
4 结论
(1) 保持应变速率均为0.001 s-1、真应变均为1.2的前提下,Al-Zn-Mg-Cu合金动态再结晶{111}/{111}近奇异晶界比例随压缩温度升高而增加,当压缩温度由450℃增加到520℃时,大角度晶界和小角晶界中的{111}/{111}近奇异晶界比例分别从2.54%和4.18%增加至4.53%和8.77%。
(2) 高温压缩过程中,稳态流变阶段主要发生初次动态再结晶;当应变超过0.7时,发生二次动态再结晶,导致组织细化和流变应力上升;二次动态再结晶包括不连续动态再结晶和连续动态再结晶,随压缩温度的提高,不连续动态再结晶行为在减弱,连续动态再结晶行为在增强。
(3) 连续动态再结晶可促进{111}/{111}近奇异晶界的形成;二次动态再结晶阶段,连续动态再结晶行为随压缩温度提高而增强的同时,{111}/{111}的近奇异晶界比例也随之增加,特别是小角度晶界中的{111}/{111}近奇异晶界比例快速增加。
参考文献
Aluminium alloys as structural material: A review of research
[J].
A review: Drilling performance and hole quality of aluminium alloys for aerospace applications
[J].
Corrosion behavior and mechanism of Al-Zn-Mg-Cu alloy based on the characterization of the secondary phases
[J].
Effect of stress-aging treatment on the mechanical and corrosion properties of Al-Zn-Mg-Cu alloy
[J].
Effects of pre-strain and aging treatments on the mechanical property and corrosion resistance of the spray formed ultra-high strength Al-Zn-Mg-Cu alloy
[J].
Effect of precipitate state on mechanical properties, corrosion behavior, and microstructures of Al-Zn-Mg-Cu alloy
[J].
Stress corrosion cracking behaviour of 7xxx aluminum alloys: A literature review
[J].
Investigation of mechanical and corrosion properties of an Al-Zn-Mg-Cu alloy under various ageing conditions and interface analysis of η′ precipitate
[J].
Effects of pre-treatments on aging precipitates and corrosion resistance of a creep-aged Al-Zn-Mg-Cu alloy
[J].
Influence of retrogression and re-aging treatment on corrosion behaviour of an Al-Zn-Mg-Cu alloy
[J].
Ageing behavior and stress corrosion cracking resistance of a non-isothermally aged Al-Zn-Mg-Cu alloy
[J].
Study of β precipitation and layer structure formation in Al 5083: The role of dispersoids and grain boundaries
[J].
Effect of grain boundary misorientation on η phase precipitation in Ni-base superalloy 718Plus
[J].
In an effort to engineer the morphology of the grain boundaries in Alloy 718Plus to be more damage tolerant, the primary aim of this study was to investigate the effect of the grain boundary misorientation on the precipitation of eta phase precipitates. Two types of eta phase precipitates were observed to form within the microstructure which formed either lamellar structures or were present as discrete eta phase precipitates. The lamellar eta phase precipitates were able to induce the formation of serrated grain boundaries, but their precipitation was not correlated to the grain boundary misorientation as they were observed to reside along approximately half of all low angle grain boundaries. However, the average length of the eta phase precipitates was found to be affected by the grain boundary misorientation, especially when the precipitates have a low inclination angle with respect to the grain boundary. The presence of discrete eta phase precipitates along the grain boundary was found to be a function of the grain boundary as they were preferentially found to form along grain boundaries with high misorientations.
Grain boundary inter-connections in polycrystalline aluminum with random orientation
[J].
A grain boundary engineering approach to promote special boundaries in Pb-base alloy
[J].
Study on Σ3 boundaries in an cold rolled and recrystallized Al-Cu alloy
[J].
冷轧变形Al-Cu合金再结晶Σ3晶界研究
[J].
The dependence of precipitate morphology on the grain boundary types in an aged Al-Cu binary alloy
[J].
{111}/{111} near singular boundaries in an Al-Zn-Mg-Cu Alloy recrystallized after rolling at different temperatures
[J].
不同温度轧制Al-Zn-Mg-Cu合金再结晶后的{111}/{111}近奇异晶界
[J].经470~520℃双级固溶处理的国产Al-Zn-Mg-Cu (7A85) 合金分别在250、300、350、400和450℃施行厚度减缩量为80%的轧制变形后,立即经520℃、30 min完成再结晶退火处理。采用基于电子背散射衍射和五参数分析的晶界界面匹配表征方法对上述试样进行测试和分析发现,轧制温度对后续再结晶退火{111}/{111}近奇异晶界的形成有显著影响,表现为{111}/{111}近奇异晶界比例随轧制温度的升高呈现先上升、然后下降至一定值并保持基本恒定的变化规律;经300℃轧制及后续再结晶退火,{111}/{111}近奇异晶界比例达到极大值5.0%,是奇异晶界(共格孪晶界)比例的近10倍。对试样显微组织进行观察和分析表明,经300℃轧制,样品中形成特定变形亚结构,并且具备一定形变储能,在后续再结晶退火过程中,其组织演化以连续再结晶为主,有利于{111}/{111}近奇异晶界的形成。相反,经350℃及以上温度轧制,试样发生了不连续动态再结晶,不利于后续退火{111}/{111}近奇异晶界的形成;经250℃轧制,试样内存在较高储能,在后续退火过程中发生了不连续再结晶,也不利于{111}/{111}近奇异晶界的形成。离线原位表面侵蚀实验和高分辨透射电子显微镜观察表明,{111}/{111}近奇异晶界的腐蚀抗力显著高于一般晶界,此类晶界具有旋错结构特征,其结构有序度显著高于一般晶界。
Hot deformation behavior considering strain effects and recrystallization mechanism of an Al-Zn-Mg-Cu alloy
[J].
Hot deformation behavior and dynamic recrystallization kinetics of a novel sc and zr modified ultra-high-strength Al-Zn-Mg-Cu alloy
[J].
Improvement of mechanical properties of AA6063 aluminum alloy after equal channel angular pressing by applying a two-stage solution treatment
[J].
Dynamic recrystallization and precipitation behavior of a novel Sc, Zr alloyed Al-Zn-Mg-Cu alloy during hot deformation
[J].
The Distribution of Internal Interfaces in Polycrystals
[J].
Measuring the five-parameter grain-boundary distribution from observations of planar sections
[J].
The distribution of grain boundary planes in interstitial free steel
[J].
Quantitative determination of grain boundary inter-connections
[P].
晶界界面匹配定量表征方法
[P].
The near singular boundaries in BCC iron
[J].
Extracting twins from orientation imaging microscopy scan data
[J].
Microstructural evolution and dynamic recrystallization of a nickel-based superalloy PM EP962NP during hot deformation at 1150oC
[J].
Kinetic model for describing continuous and discontinuous dynamic recrystallization behaviors of 2195 aluminum alloy during hot deformation
[J].
Dynamic recrystallization mechanisms of 2195 aluminum alloy during medium/high temperature compression deformation
[J].
Critical comparison of dislocation boundary alignment studied by TEM and EBSD: Technical issues and theoretical consequences
[J].
Grain refining with DDRX by isothermal MDF of Al-Zn-Mg-Cu alloy
[J].
Hot deformation behavior and microstructural evolution of the Al-Cu-Li alloy: A study with processing map
[J].
