


梯度结构是由一种形态逐渐向另一种形态渐变的结构。在很多生物结构中都能够观察到梯度结构的存在,比如骨骼、竹子、贝壳等[1]。生物材料中的梯度结构是经过自然界长时间选择和进化的结果,具有一些特定的优异性能,如轻质、高强。受生物梯度结构材料的启发,梯度纳米结构金属材料的设计应运而生。金属材料的梯度结构主要包括:晶粒尺寸梯度、位错密度梯度、孪晶层片厚度梯度、固溶浓度梯度、相梯度以及混合梯度等结构[2,3]。近年来,对梯度晶粒结构材料的制备、力学性能、疲劳性能、摩擦磨损行为、变形机理和固体本构理论等的研究比较丰富[4,5,6,7],梯度纳米孪晶金属中的额外强化与加工硬化研究也取得了重要突破[8,9]。但是,关于位错密度梯度结构的研究却鲜有报道。
离散位错动力学(discrete dislocation dynamics,DDD)模拟在研究位错的动态演化和位错间的相互作用方面极具优势[13,14,15,16,17,18]。近20年来,大量学者基于离散位错动力学框架研究了位错微结构演化与小尺寸晶体材料力学行为之间的联系,揭示材料的塑性变形机制。Weinberger和Cai[19]研究了表面位错形核对微柱压缩尺寸效应的影响。Senger等[20]模拟了微柱压缩的塑性响应与试样的高宽比和初始位错微结构的关系。El-awady[21]基于离散位错动力学模拟结果,揭示了不同位错密度会导致不同的硬化机制。Li等[22]和Huang等[23]系统地研究了位错与内界面的交互作用对材料力学行为的影响,以及金属多层膜的高温力学行为[24]和镍基高温合金的力学性能[25]。Liu等[26]和Cui等[27]通过离散位错动力学模拟揭示了微柱压缩应变陡增现象和尺寸效应的机理。Fan等[28]研究了Mg中孪晶的尺寸和取向对材料屈服强度和硬化率的影响。郭祥如等[29]基于三维离散位错动力学研究了Ni单晶微柱在不同应变率下压缩的微观变形机制及力学响应。但是,关于位错密度梯度结构材料微柱压缩行为的研究还未见报道。本工作基于三维离散位错动力学模拟平台ParaDiS[13],研究位错密度梯度结构Cu单晶微柱的压缩行为,并进一步揭示加载方向对压缩响应的影响。
1 三维离散位错动力学框架
1.1 节点力计算
在离散位错动力学模拟中,位错会被离散成很多小的位错直线段,如图1所示。位错节点主要分为2类:一类是真实存在的物理节点,包括位错连接点(红色)和表面节点(绿色)。位错连接点一般是3个或3个以上位错交汇的节点,或者是2个不同滑移面的位错交汇的节点;另一类是虚拟节点,即同一滑移面的2个位错线段的交点(蓝色),这些虚拟的节点可以通过一定的规则进行重划分。
图1
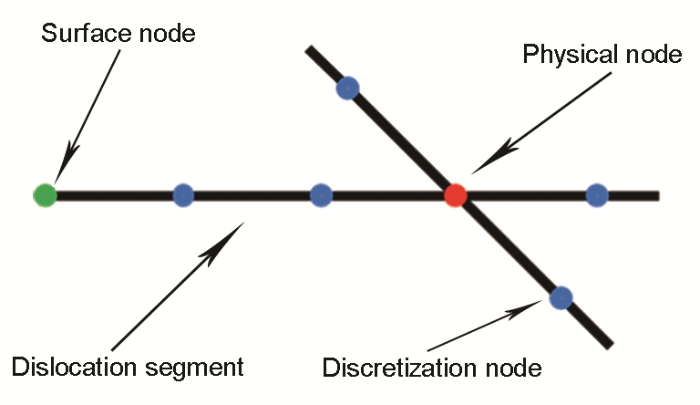
图1
离散位错动力学模拟中位错的离散化处理
Fig.1
Dislocation discretization in the discrete dislocation dynamics simulation (The red node is the physical node, representing the real dislocation node; the blue nodes are the discretization nodes, which are generated according to certain rules; the green point is the surface node, which connects a dislocation segment; the black line is the dislocation segment)
Color online
每个节点i的受力(Fi)可以由位错系统整体储能(φ)的空间偏导数得到,即[13]:
式中,Xi为节点i所在的空间坐标,φ是关于所有节点位置(Xj)、与节点j相连的位错段的Burgers矢量(bjk)和外部施加表面牵引力(Ts)的函数,分为2部分:一部分是与位错芯的局部原子组态相关的能量(φc);另一部分是与长程弹性变形相关的能量(φel),即[13]:
所以Fi的计算也可以分为2部分,即[13]:
式中,Fic、Fiel分别为节点i受到的位错芯能产生的力和长程弹性变形产生的力。
式(2)中的φc可以表示为[13]:
式中,tij=lij /
通常情况下,Fic可以认为是与节点i相连接的所有位错段lij由于晶格变形产生对节点i的作用力(fijc)之和,结合式(1)和式(4)可得到[13]:
式中,I2为二阶单位张量。等式(6)右边的第一部分表示使位错段收缩的线张力,沿位错线方向;第二部分是使位错芯能最小而作用的旋转力,垂直于位错线方向。
由于长程弹性变形而作用在位错节点i的力(Fiel)为[31]:
式中,fijel表示位错段lij受到的弹性作用力[13]:
式中,N表示位错的形函数,l为位错段长度,fijpk表示位错段lij在应力场中受到的Peach-Koehler力,包括外部载荷产生的应力场(σext)、位错段自身产生的应力场(σs)以及其它位错段产生的应力场(
式中,[k, l]≠[i, j] or [j, i]。
在离散位错动力学中,由于设置的加载步长足够使位错达到稳定的状态,故而可以忽略位错段的惯性力的作用,位错段的运动方程通常可以简化为[29]:
式中,B为阻尼系数,vi为位错段节点i的速度。通过此运动方程,可追踪和描述每个位错段的时空演化。
1.2 塑性应变计算
当一个Burgers矢量为b的位错段在法向量为n的滑移面上滑移时,通过计算位错段滑移的面积可得位错滑移对塑性应变的贡献。单个位错段m在计算时间步dt内的滑移对整个计算模型的塑性应变增量(Δεpm)的贡献为[32]:
式中,V为模型的体积,dS是位错段滑移时滑过的面积。计算时间步dt内位错滑移产生的总塑性应变增量(Δεp)为:
2 计算模型
2.1 几何模型
本工作模拟的梯度位错密度结构材料的模型尺寸为1 μm×1 μm×3 μm,设置位错密度沿Z轴呈梯度变化。Senger等[33]发现,当试样底边长度大于1 μm时,高宽比引起的硬化效应可以忽略不计。因此,进一步将试样沿Z轴方向分为3层,每层为边长为1 μm的正方体。设置单个位错源长度约为400 nm,在模型的底层、中层和高层随机生成100、200和300个Frank-Read位错源,进而形成一定的位错密度梯度结构。第a层的位错源密度(ρa)为:
式中,na为第a层的位错源数量,lFRS为单个位错源长度。位错平均间距(da)为:
表1 模型各层的位错源数量、初始位错密度与位错间距
Table 1
Layer | Number of source | Dislocation density 1012 m-2 | Dislocation spacing nm |
|---|---|---|---|
| Bottom layer | 100 | 38.0 | 162 |
| Middle layer | 200 | 76.5 | 114 |
| Top layer | 300 | 114.0 | 93 |
2.2 材料参数
林位错硬化控制材料塑性变形过程时,塑性变形的临界分切应力(τcr)与位错密度(ρ)满足Taylor关系[34]:
式中,α为Taylor强化因子,通常取值为0.2~0.5;μ为材料的剪切模量;b为Burgers矢量模。目前的离散位错动力学模拟框架采用的是各向同性假设,即忽略了材料弹性性质的各向异性。各向同性弹性常数(μ和Poisson比v)与fcc结构单晶材料各向异性弹性常数(C11、C12、C44)之间满足Voigt-Reuss-Hill等效[35]:
对于单晶Cu,C11=168.4 GPa、C12=121.4 GPa、C44=75.4 GPa,可得Cu的剪切模量为54.6 GPa、Poisson比为0.324。fcc结构Cu单晶微柱压缩模拟的其它材料参数见表2。
表2 Cu单晶微柱离散位错动力学模拟的材料参数
Table 2
| Parameter | Value | Unit |
|---|---|---|
| Burgers vector (b) | 0.256 | nm |
| Mean dislocation density (ρ) | 76.5 | 1012 m-2 |
| Mean dislocation source length (lFRS) | 400 | nm |
| Poisson's ratio (ν) | 0.324 | - |
| Shear modulus (μ) | 54.6 | GPa |
| Drag coefficient (B) | 1×10⁻⁴ | Pa·s |
2.3 边界条件
Cu单晶微柱的X、Y、Z轴分别对应晶向[1
图2

图2
位错密度梯度结构模型在不同加载方向下的初始位错构型
Fig.2
Initial dislocation configurations of dislocation density gradient structure model under different loading directions (The colors of dislocation lines in the graph represents different types of Burgers vectors of dislocations)
Color online
(a) the loading direction is perpendicular to the direction of dislocation density gradient, the arrows indicate loading direction
(b) the loading direction is parallel with the direction of dislocation density gradient, the arrows indicate loading direction
3 结果与讨论
3.1 位错密度梯度结构Cu单晶微柱压缩响应的各向异性
图3给出了位错密度梯度结构Cu单晶微柱在不同加载方向下的应力-应变曲线及位错密度演化曲线。沿X轴加载(加载方向垂直于位错密度梯度方向)时,Cu单晶微柱会在更低的应力水平时进入塑性屈服,而沿Z轴加载(加载方向平行于位错密度梯度方向)时,Cu单晶微柱会在较高的应力水平屈服。但是,在后续的塑性变形过程中,2个微柱模型的流动应力会达到同一个相对稳定的水平。
图3
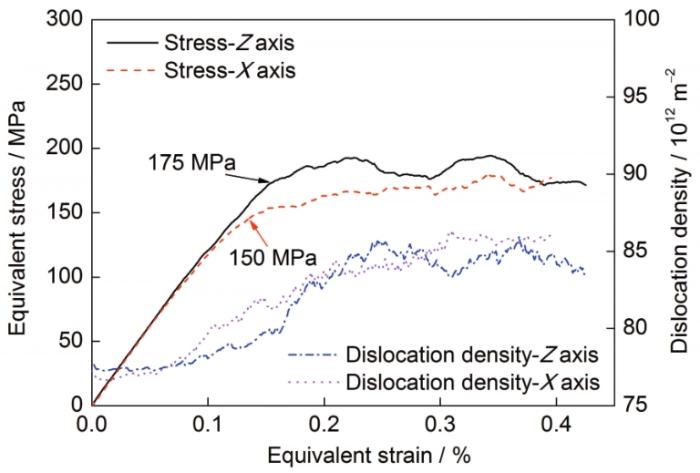
图3
位错密度梯度结构Cu单晶微柱在不同加载方向下的等效应力-应变曲线以及位错密度演化曲线
Fig.3
Equivalent stress-strain curves and dislocation density evolution curves of single crystal copper micropillar with dislocation density gradient structure under different loading directions
外部加载应力(σ)与作用在位错线上的分切应力(τ)之间的关系可以通过Schmid定律来表达[34]:
式中,M是Schmid因子,ϕ为加载轴与滑移面法向的夹角,θ为加载轴与滑移方向的夹角。加载方向沿X ([1
表3 不同加载方向下Cu单晶微柱各个滑移系的Schmid因子
Table 3
| Slip system | X direction [1 | Z direction [ |
|---|---|---|
| (111)[ | 0 | 0 |
| (111)[ | 0 | 0 |
| (111)[0 | 0 | 0 |
| ( | 0 | 0.272 |
| ( | 0.408 | 0.136 |
| ( | 0.408 | 0.408 |
| (1 | 0 | 0.272 |
| (1 | 0.408 | 0.136 |
| (1 | 0.408 | 0.408 |
| (11 | 0 | 0 |
| (11 | 0 | 0.272 |
| (11 | 0 | 0.272 |
图4
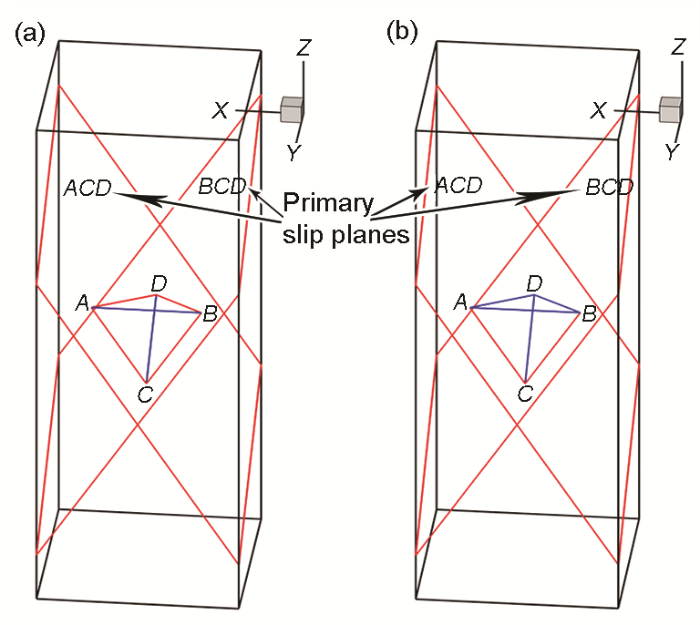
图4
不同加载方向下的主滑移系
Fig.4
Primary slip systems under two different loading directions (The planes ACD (normal vector is (
Color online
(a) along X axis (b) along Z axis
3.2 加载方向垂直于位错密度梯度时变形机理分析
图5显示的是当加载方向为X轴方向时,加载应变为0.05%、0.10%、0.15%、0.20%以及0.25%时的位错结构。可以看出,当应变较低时,材料主要发生弹性变形,位错在外力作用下产生可逆的弓曲变形。而当应变加载到约0.15%时,模型开始进入塑性阶段,位错源开动并增殖,从而导致了位错密度的增加,根据前文中的Taylor硬化关系,位错密度增加使得位错更难开动,从而产生了硬化。通过不同应变时刻的位错微结构可以发现,Burgers矢量为[110]和[1
图5
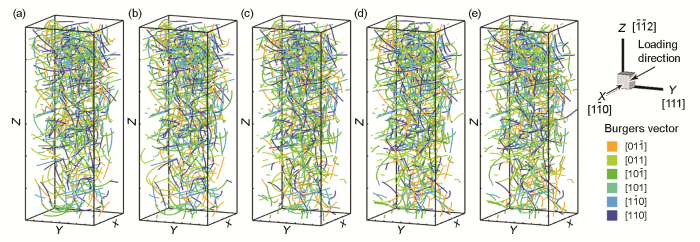
图5
位错密度梯度结构模型沿X轴加载时不同应变时的位错微结构
Fig.5
The snapshots of evolved dislocation structures corresponding to strains of 0.05% (a), 0.10% (b), 0.15% (c), 0.20% (d) and 0.25% (e) in the compression process along the X-axis direction which is perpendicular to the dislocation density gradient direction
Color online
图6显示了X轴加载时不同应变时刻的塑性应变云图。值得注意的是,顶部的塑性应变集中区是一种偶然现象,这是由于位错间的反应,生成了很长的容易开动的位错源。这种一端固定,另一端沿着2个滑移面交线运动,进而能够逐渐变长的位错源,在很小的应力下就可以开动并且增殖,而这一部分位错的滑移对其它位错的影响可以忽略。从图6可以看出,当模型加载到达塑性阶段时,位错的激活和滑移首先发生在位错密度最小的底层;随应变不断增加,位错密度较高的中间层和位错密度最高的顶层相继发生位错源的激活与开动,塑性变形以多个滑移系开动的形式进行。图7进一步给出了各层塑性应变和位错密度随应变的演化过程。从图7a可以发现,位错密度最小的底层在应变加载达到0.10%之后有一个较大的塑性应变增量,而中间层在0.15%的应变之后有一个较明显的塑性应变的增加,而最顶层的塑性应变的增加发生在应变0.2%之后。这与图6分析得出的塑性变形过程吻合。而从图7b可以发现,各层的位错密度随着应变加载的增加并没有很明显的变化。通过分析发现,位错密度在塑性变形过程中几乎不变的主要原因是,位错源激活导致位错密度增加和位错滑出试样表面导致的位错密度减少2个过程达到了动态的平衡。
图6
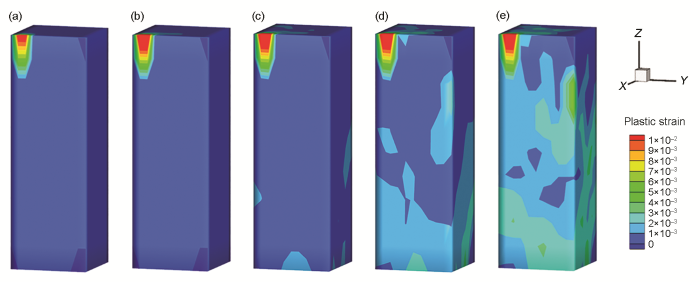
图6
位错密度梯度结构模型沿着X轴方向加载时在不同应变时表面的塑性应变分布
Fig.6
Distributions of plastic strain on the surface corresponding to strains of 0.05% (a), 0.10% (b), 0.15% (c), 0.20% (d) and 0.25% (e) in the compression process along the X-axis direction which is perpendicular to the dislocation density gradient direction
Color online
图7
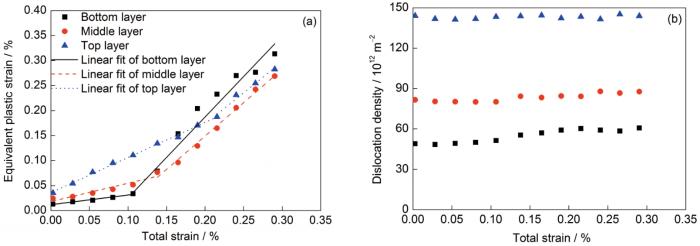
图7
位错密度梯度结构模型沿X轴加载时,位错密度不同的各层塑性应变及位错密度随应变的变化
Fig.7
The evolutions of plastic strain (a) and the dislocation density (b) in bottom, middle and top layer, which have different dislocation densities, when loading direction is along X-axis which is perpendicular to the dislocation density gradient direction
3.3 加载方向平行于位错密度梯度的变形机理分析
图8给出了沿Z轴加载时,不同应变时刻的位错微结构。当应变较小时,与图5类似,位错段发生可逆的弓曲变形,材料整体处于弹性变形阶段。而当加载应变大于0.15%后,有大量Burgers矢量为[10
图8
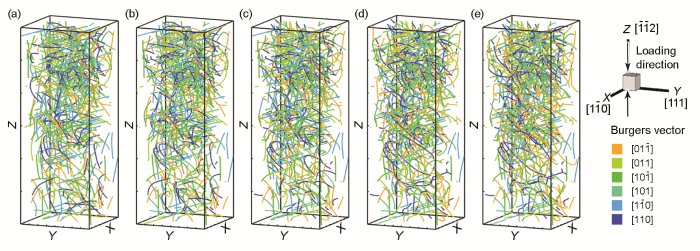
图8
位错密度梯度结构模型沿Z轴加载时不同应变时的位错微结构
Fig.8
The snapshots of evolved dislocation structure corresponding to strains of 0.05% (a), 0.10% (b), 0.15% (c), 0.20% (d) and 0.25% (e) in the compression process along the Z-axis direction which is parallel with the dislocation density gradient direction
Color online
图9
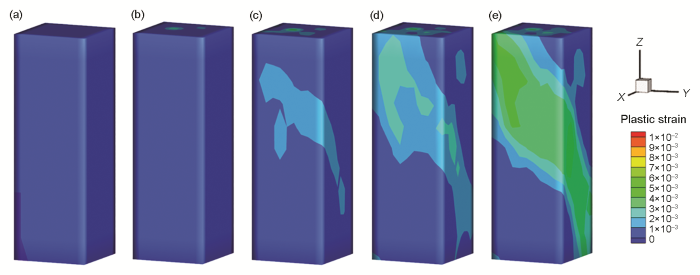
图9
位错密度梯度结构模型沿着Z轴方向加载时在不同应变时表面的塑性应变分布
Fig.9
Distributions of plastic strain on the surface corresponding to strains of 0.05% (a), 0.10% (b), 0.15% (c), 0.20% (d) and 0.25% (e) in the compression process along the Z-axis direction which is parallel with the dislocation density gradient direction
Color online
图10
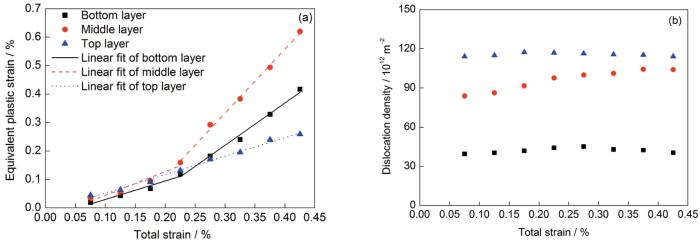
图10
位错密度梯度结构模型沿Z轴加载时,位错密度不同的各层塑性应变及位错密度随应变的变化
Fig.10
The evolutions of plastic strain (a) and the dislocation density (b) in bottom, middle and top layer, which have different dislocation densities, when loading direction is along Z-axis which is parallel with the dislocation density gradient direction
通过对2种加载方向下的结果进行对比,可以得到不同加载方向对位错密度梯度结构材料的力学响应的差异:X轴加载时,加载方向垂直于位错密度梯度方向,各层在加载方向的受力相对比较独立,而底层位错密度较低,临界分切应力低,所以首先发生塑性变形。当底层的位错滑移到达中间层时,由于中间层的位错密度更大而需要更大的临界剪切应力才能开动,而此时底层的其它滑移系的位错也由于达到临界剪切应力而开始开动,而这也是产生多个滑移带的原因。随着加载应变的增加,位错受到的应力也不断增加,当应力水平达到中层的临界剪切应力时,中间层的位错也随之开动。最后,顶层的位错才会被激活并增殖。因此,微柱是逐层屈服的。Z轴加载时,加载方向平行于位错密度梯度方向,底层位错向着Z轴正方向滑移,随后会遇到更高位错密度层的阻碍,这也就导致了加载方向为Z轴时其临界剪切应力较大的现象。随着应力的增加,中间层位错的受力达到了临界剪切应力而发生了激活并滑移,此时由于滑移面的宽度限制,位错从中间层滑移到侧表面逃离,导致塑性变形首先在中间层发生,而由于加载方向为Z轴时一个滑移面只有一个最易开动的滑移系,这也就导致了单滑移的发生,进而整个模型只有一个滑移带。
从上述对比分析可知,加载方向对位错密度梯度结构的各个位错密度层的影响差异较大,当加载方向垂直于位错密度梯度方向时,位错的开动顺序是由位错密度最低的层逐层发展到位错密度更高层,并且伴随有多个滑移带产生;加载方向平行于位错密度梯度方向时,位错的开动主要发生在中间层,并逐渐向相邻层扩散,并且只有一个较集中的滑移带产生。
4 结论
(1) 建立了位错密度梯度结构Cu单晶微柱的压缩变形的3D-DDD模型,该模型能展示位错在外载作用下的演化过程,从而更好地理解材料的变形机制。
(2) 加载方向对位错密度梯度结构Cu单晶微柱压缩响应有较大的影响,当加载方向垂直于位错密度梯度方向(X轴)时,会产生多个滑移带,整体的塑性变形更加均匀。而当加载方向平行于位错密度梯度方向(Z轴)时,位错的滑移主要发生在一个滑移面上。但是,当加载应变达到一定值后,2种不同加载方向下的流动应力的差异消失。
(3) 加载方向会对位错密度梯度结构材料不同位错密度层的塑性行为产生影响。当加载方向垂直于位错密度梯度方向时,位错开动顺序是由位错密度最低的层逐层发展到位错密度更高的层,并且在较低的应力水平就进入应变硬化阶段;当加载方向平行于位错密度梯度方向时,位错的开动主要发生在位错密度较高的中间层,并逐渐向相邻层扩散,进而使其需要更高的临界应力才能进入应变硬化阶段。
