Steel structures exposed to offshore atmospheric environment for a long time inevitably suffer from corrosion damage. Safety assessment of corroded steel structures largely depends on the quantification of corroded surface features as the irregular corrosion characteristics are the main factors causing decline in steel mechanical properties. To investigate the structural steel corrosion characteristics in offshore atmospheric environment, accelerated corrosion tests were conducted on 16 pieces of Q235B steel plates by periodic spraying to simulate the offshore atmospheric environment. Moreover, the surface morphologies and characteristic parameters were measured and analyzed using a ST400 3D Noncontact Profilometer and a self-written algorithm. The distribution characteristics such as corrosion depth, pit depth, and aspect ratio were elucidated, and the changing laws of statistical parameters such as mean value, standard deviation, and pitting shapes were revealed. The results indicated that in the simulated offshore atmospheric environment, the structural steel corrosion process generally goes through three stages: scab, swell, and spall. The scab and swell stages are dominated by pitting corrosion, whereas, the spall stage shows the general corrosion characteristics. Moreover, the corrosion depth of structural steel in the simulated offshore atmospheric environment conforms to the normal distribution, whereas, the pit depth and aspect ratio conform to the log-normal distribution. As the degree of corrosion increases, the mean value and standard deviation of the corrosion depth, peak value of the power spectral density of the corrosion depth, and logarithmic mean value of the pit depth also gradually increase, whereas, the logarithmic mean value of the pit aspect ratio decreases. Meanwhile, at different ages, the cone pits have the highest proportion, and the pit shape gradually changes from a cylinder or a hemisphere to a cone. Finally, based on the results of the statistical analysis of the corrosion depth and pit parameters, the stochastic field model of corrosion depth and random distribution model of corrosion pits were constructed, which achieved the accurate characterization and reproduction of the surface morphology of the corroded steel in a simulated offshore atmospheric environment. The research results would lay the foundation for the establishment of an accurate stochastic model and structural reliability analysis in the natural offshore atmospheric environment.
WANG Youde, ZHOU Xiaodong, MA Rui, XU Shanhua. Stochastic Model for Surface Characterization of Structural Steel Corroded in Simulated Offshore Atmosphere. Acta Metallurgica Sinica[J], 2021, 57(6): 811-821 DOI:10.11900/0412.1961.2020.00326
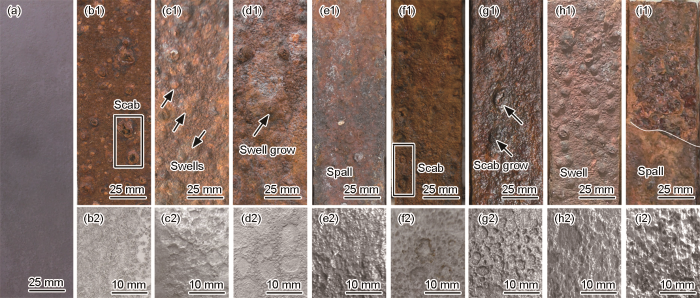
(a) S0, 0 d (b1, b2) S1, 30 d (c1, c2) S2, 70 d (d1, d2) S3, 110 d (e1, e2) S4, 150 d (f1, f2) S5, 250 d (g1, g2) S6, 310 d (h1, h2) S7, 370 d (i1, i2) S8, 440 d
Fig.1
Corrosion features of Q235B steel specimens with different ages before (b1-i1) and after (b2-i2) descaling
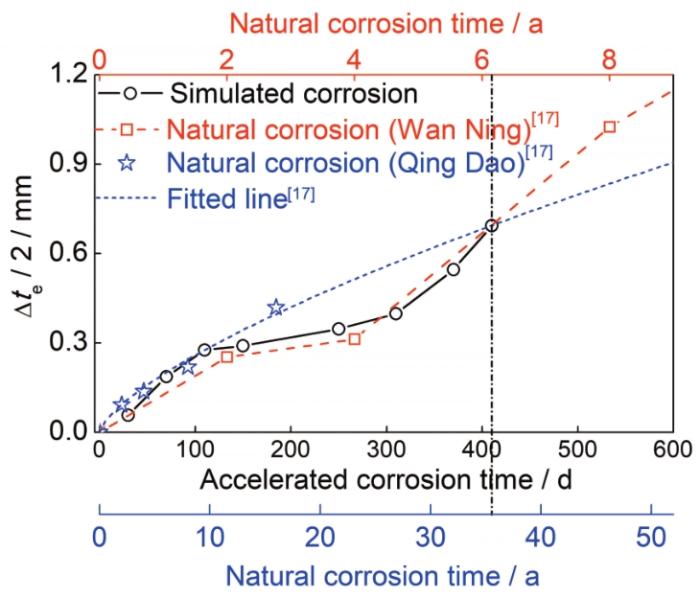
Fig.2
Comparisons between the corrosion losses of steel under accelerated and natural[17] offshore atmospheric environment (Δte / 2 refers to the single-sided equivalent thickness loss, which is equal to ηT0 / 2; η is the mass loss ratio, and T0 is the initial thickness)
Fig.3
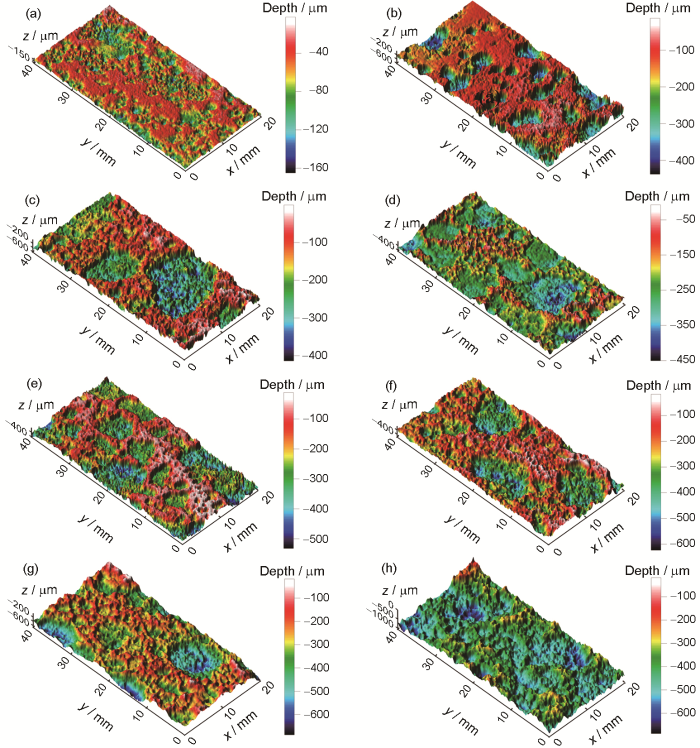
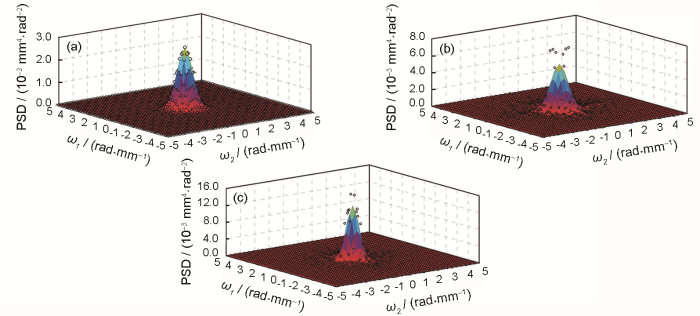
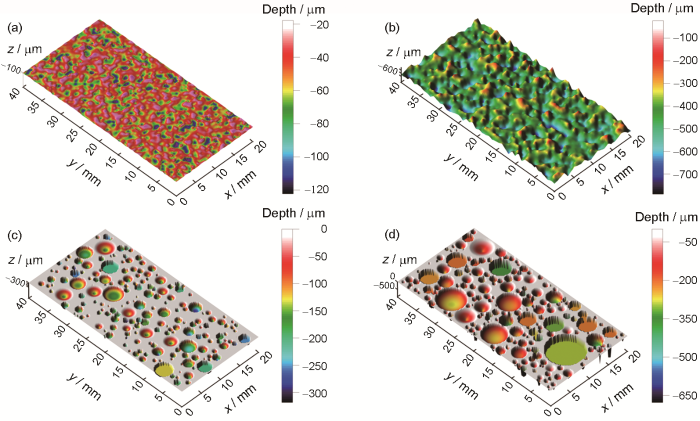
Surface morphologies of corroded specimens (z is the corrosion depth relative to the vertex of surface)
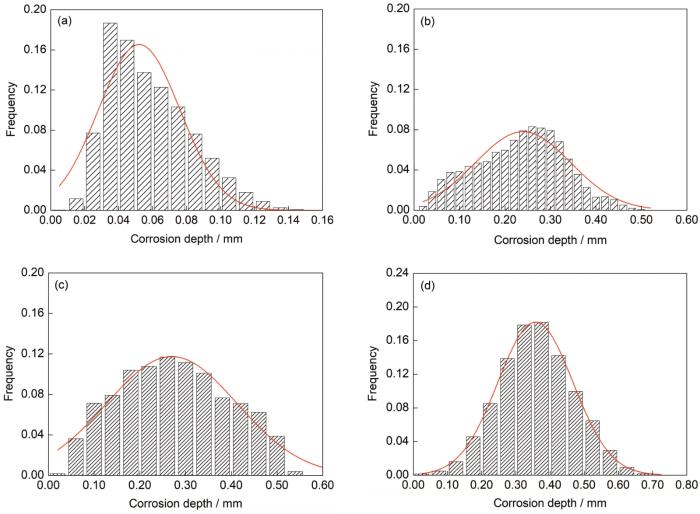
2.2 锈蚀深度分析
图4给出了部分加速腐蚀试件的锈蚀深度频率直方图。可以看出,锈蚀深度大致服从正态分布;龄期为30 d (S1)时,锈蚀深度较小且主要分布于0~140 μm;龄期为110 d (S3)时,锈蚀深度分布范围增长至0~500 μm,但锈蚀深度均值处相对频率逐渐降低,表明此前锈蚀以纵向发展为主;龄期150 d (S4)时,锈蚀深度分布范围一直维持在0~500 μm,说明锈蚀以横向发展为主;锈层剥落后,锈蚀重新变为以纵向发展为主,到440 d (S8)龄期时,锈蚀深度分布范围扩大到0~700 μm。随着腐蚀时间的延长,锈蚀深度分布区间逐渐增大,说明锈蚀更加严重,表面更加粗糙。
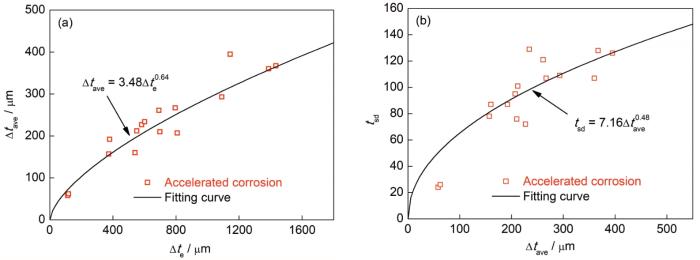
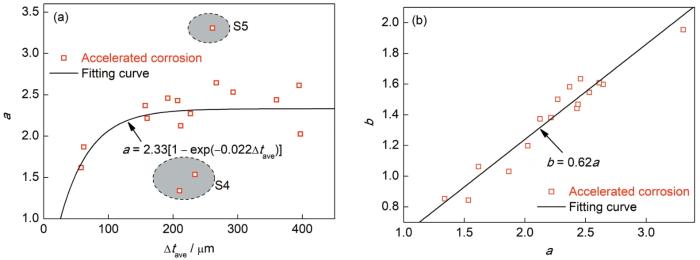
Table 1 Corrosion depth parameters and pitting characteristic parameters
Sample
No.
Δte
μm
Δtave
μm
tsd
μm
a
b
Pd
cm-2
μh
σh
μAr
σAr
S1-1
114
58
24
1.618
1.062
15.3
4.55
0.24
2.21
0.44
S1-2
119
62
26
1.867
1.031
19.8
4.23
0.15
2.19
0.41
S2-1
374
157
78
2.369
1.583
21.9
5.33
0.19
1.60
0.50
S2-2
379
192
87
2.458
1.635
19.0
5.49
0.33
1.53
0.55
S3-1
552
212
101
2.124
1.374
18.5
5.64
0.25
1.33
0.61
S3-2
540
160
87
2.215
1.382
15.6
5.40
0.38
1.49
0.63
S4-1
582
227
72
2.271
1.501
18.0
5.62
0.22
1.31
0.62
S4-2
602
234
129
1.535
0.844
13.4
5.56
0.47
1.50
0.47
S5-1
692
261
121
3.306
1.955
23.0
5.60
0.48
1.56
0.55
S5-2
698
210
76
1.338
0.853
24.1
5.72
0.17
1.37
0.39
S6-1
796
267
107
2.644
1.598
25.1
5.97
0.26
1.19
0.55
S6-2
808
207
95
2.429
1.442
21.8
5.66
0.27
1.19
0.50
S7-1
1091
293
109
2.531
1.546
21.1
5.95
0.23
1.07
0.59
S7-2
1144
395
126
2.613
1.609
20.9
6.28
0.13
0.81
0.61
S8-1
1387
360
107
2.438
1.469
23.5
6.22
0.17
0.79
0.54
S8-2
1434
397
128
2.024
1.198
19.0
6.38
0.14
0.74
0.48
Note: Δte—equivalent thickness loss converted from corrosion loss ratio; Δtave and tsd—mean value and standard deviation of corrosion depth, respectively; a and b—power spectral parameters of corroded surfaces; Pd—pit density; μh and σh—logarithmic mean value and standard deviation of pit depth, respectively; μAr and σAr—logarithmic mean value and standard deviation of pit aspect ratio, respectively
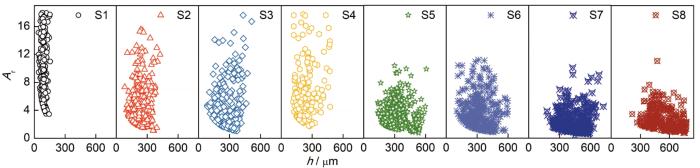
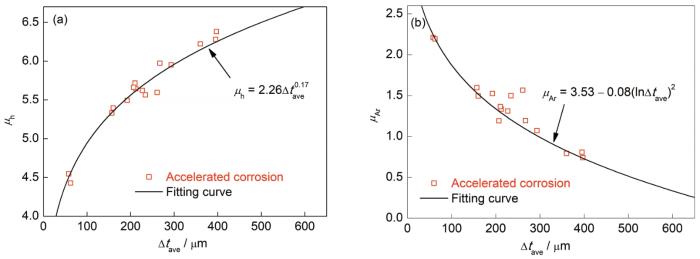
图8给出了所有腐蚀试件h和Ar提取结果。可以看出,锈坑深度的变化规律与前文锈蚀深度大致相同。龄期为30 d (S1)时,h较小且主要分布于50~140 μm,Ar大致分布于3~18;龄期为110 d (S3)时,h分布范围增长至80~490 μm,Ar略微减小,说明此前锈坑以纵向生长为主;在龄期150 d (S4)内,h分布范围变化不明显,而Ar略微增长,说明剥落期内锈坑横向生长和融合占据主导;而后Ar持续降低,h分布范围逐渐增大至210~700 μm,说明锈层剥落后,锈坑以纵向生长为主,点蚀特征重新变得明显。
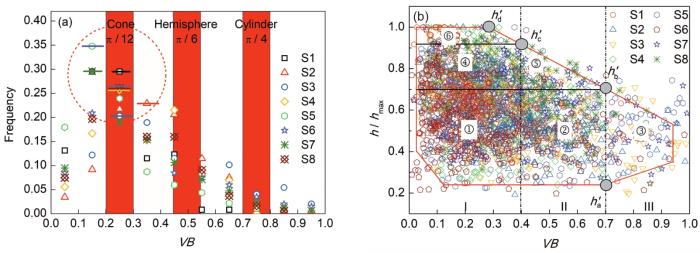
(a) statistical results of volume-box parameter (VB) (b) relationship between pit depth and shape
Fig.10
Pitting shape analyses (hmax—maximum depth of pits; h / hmax—relative depth of pit; h'a, h'b, h'c, and h'd—relative depths of pits; I, II, and III—regions of cone, hemisphere, and cylinder pits divided by VB value, respectively; ①-⑥—distribution zones of the three shapes of pits in the range of different relative depths (h'a-h'b, h'b-h'c, and h'c-h'd))
Fig.11
Reconstructed surfaces of structural steel corroded in offshore atmosphere based on the stochastic field model of corrosion depth (SFCD) and the random distribution model of corrosion pits (RDCP)
... [17]近海大气环境下钢材腐蚀失厚对比Comparisons between the corrosion losses of steel under accelerated and natural<sup>[<xref ref-type="bibr" rid="R17">17</xref>]</sup> offshore atmospheric environment (Δ<i>t</i><sub>e</sub> / 2 refers to the single-sided equivalent thickness loss, which is equal to <i>ηT</i><sub>0</sub> / 2; <i>η </i>is the mass loss ratio, and <i>T</i><sub>0</sub> is the initial thickness)Fig.2
... [17] offshore atmospheric environment (Δte / 2 refers to the single-sided equivalent thickness loss, which is equal to ηT0 / 2; η is the mass loss ratio, and T0 is the initial thickness)Fig.2


