Progress in Failure Mechanisms and Modification Strategies of Nickel-Based Alloys for Molten Salt Reactors
WANG You1,2, CHEN Xiangyang,1,2, WANG Xujia,1, TANG Chuntao1, SHEN Zhao,3, ZENG Xiaoqin3
1 Shanghai Nuclear Engineering Research & Design Institute Co. Ltd. , Shanghai 200233, China
2 Stage Key Laboratory of Materials for Advanced Nuclear Energy, Shanghai Nuclear Engineering Research & Design Institute Co. Ltd. , Shanghai 200233, China
3 School of Materials Science and Engineering, Shanghai Jiao Tong University, Shanghai 200240, China
National Natural Science Foundation of China(U25B20113) National Natural Science Foundation of China(52471043) Young Elite Scientist Sponsorship Program by CAST(TESS20240818) Qi Ming Xing Program of Shanghai(24YF2718700)
The molten salt reactor (MSR) is an important reactor type in Generation IV nuclear systems. However, the high-temperature, corrosive, and irradiation-coupled environment of MSRs compromises the chemical stability and service reliability of structural materials. Nickel-based alloys, featuring an fcc matrix with high thermal stability and low chemical activity, are promising candidates but remain susceptible to selective corrosion dissolution, Te-induced corrosion cracking, and irradiation-accelerated corrosion. This review summarizes the multifield-coupled failure mechanisms of Ni-based alloys for MSRs and outlines a four-dimensional modification framework of “composition optimization, secondary phase regulation, grain boundary regulation, and coating protection”. Lowering the Cr content and optimizing the Mo / W ratios collectively suppress selective dissolution; secondary phase/oxide dispersion strengthened particles trap defects and block diffusion; grain boundary engineering suppresses Te penetration by increasing the fraction of low-Σ boundaries; Ni-W or silicon carbide coatings provide terminal protection. Future efforts should focus on in situ multifield characterization, machine learning-based design, and environment-adaptive regulation of Ni-based alloys to achieve their long-term reliability and engineering application in MSRs.
Keywords:nickel-based alloy;
molten salt reactor;
failure mechanism;
modification strategy
WANG You, CHEN Xiangyang, WANG Xujia, TANG Chuntao, SHEN Zhao, ZENG Xiaoqin. Progress in Failure Mechanisms and Modification Strategies of Nickel-Based Alloys for Molten Salt Reactors[J]. Acta Metallurgica Sinica, 2026, 62(8): 1331-1346 DOI:10.11900/0412.1961.2025.00407
核能作为低碳基荷能源的重要支撑,其安全性、经济性和可持续发展已成为全球能源结构转型的关键议题。第四代核能系统以其固有安全特性、高燃料利用率和核废料最小化等优势,被视为应对全球能源与环境双重挑战的战略方向之一[1]。其中,熔盐堆(molten salt reactor,MSR)作为代表性堆型,采用熔融盐作为燃料载体和冷却介质,具有负温度反馈系数、常压运作和在线燃料处理等技术特征[2],不仅在热效率和安全性方面表现优越,还可与钍基燃料循环深度结合,从而提高核燃料利用效率,并通过在线后处理技术降低长寿命核废料累积[3]。因此,围绕熔盐堆开展的Th资源战略转化、液态燃料在线处理与先进核能系统自主化研究,已成为先进核能领域的重要技术方向。
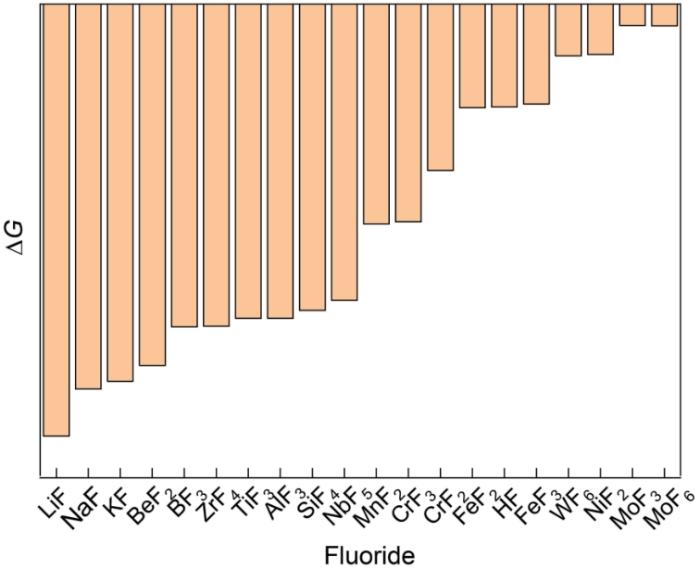
式中,M代表Li、K、Na、Be等常用元素。式(1)和(2)为氟盐水解反应的通式,后续热力学数据均以700 ℃为计算温度。水解反应产生的气态HF会迅速溶解在熔盐中,形成液态HF,显著加速活性元素溶解。Zheng等[10]使用HSC Chemistry 6.0软件计算了常见活性元素与熔盐组分的化学反应和700 ℃下反应的ΔG,如表1[10]所示。虽然不同团队采用的热力学计算软件有所差异,但得到的氟化物的ΔG排序基本一致,如图1[11~13]所示,反映出熔盐体系中元素活泼性的普适规律:在FLiNaK体系中,Li、Na、K、Be最易发生反应;而常见结构材料中Ni的惰性最强,Fe次之,Cr最易溶解;微合金元素的惰性顺序为Mo > W > Mn > Nb > Si > Al > Ti > Zr > B。
Table 1 Summary of chemical reactions between common active elements and molten salt components and Gibbs free energy changes (ΔG) for reactions at 700 oC[10]
Fig.2
Top surface and cross-sectional SEM images and corresponding elemental analyses of Ni80Cr20, 800H, and GH3535 alloys after corrosion in molten FLiNaK salt (a1-a3) top surface SEM image (a1) and corresponding EDS elemental mappings of Ni (a2) and Cr (a3) in Ni80Cr20 alloy after 4.5 h corrosion at 600 oC[14] (b1-b3) local cross-sectional SEM image (b1) and corresponding EDS elemental mappings of Ni (b2) and Cr (b3) in Ni80Cr20 alloy after 4.5 h corrosion at 600 oC[14] (c1-c3) cross-sectional SEM image (c1) and EPMA images showing the elemental distributions of Cr (c2) and Ni (c3) in 800H alloy after 300 h corrosion at 850 oC[15] (d1-d3) cross-sectional SEM image (d1) and EPMA images showing the elemental distributions of Cr (d2) and Ni (d3) in GH3535 alloy after 300 h corrosion at 850 oC[15]
Fig.3
BSE images and elemental line-scan profiles of alloy 625 after 48 h corrosion in molten FLiNaK salt containing 0.5%Te at 700 oC[23] (a), EPMA image and corresponding elemental map showing Te penetration along grain boundaries after corrosion in Te-containing molten salt[24] (b), cross-sectional morphology and EPMA elemental mappings of GH3535 alloy after 1000 h corrosion in molten FLiNaK salt containing Te at 700 oC[26] (Arrows show the carbides) (c), and room-temperature tensile curves and morphologies (insets) of 304 stainless steel[27] (w/o—without) (d1) and GH3535 alloy[24] (d2) before and after corrosion in Te-containing molten salt
(a) cross-sectional morphologies of stress-free sample and creep sample after corrosion in molten salt at 565 oC for 830 and 1068 h
(b1, b2) comparisons of thickness of corrosion layer (b1) and corrosion rate (b2) between stress-free sample and creep sample after corrosion in molten salt at 565 oC
(c) schematics of stress corrosion cracking mechanism (GB—grain boundary)
Fig.4
Corrosion-induced cracking behaviors of 316L stainless steel under applied stress and the schematics of the stress corrosion cracking mechanism[31]
Fig.6
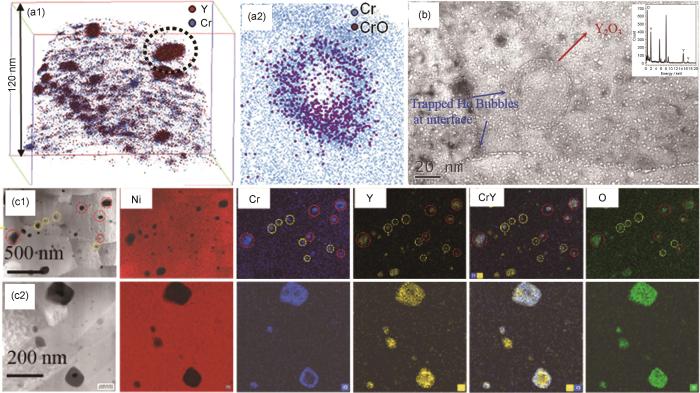
Mechanisms of the secondary phase/matrix interface in enhancing corrosion and irradiation resistances[60,62,64] (a1, a2) Cr adsorption and diffusion blocking (Fig.6a2 shows the Cr-rich shell around the particle marked by the circle in Fig.6a1)[60] (b) helium bubble suppression[64] (c1, c2) microstructures of NiMoCr-oxide dispersion strengthened (ODS) alloy after irradiation and molten salt exposure at different magnifications (Yellow circles mark grain boundary areas, and red circles indicate matrix regions)[62]
Fig.7
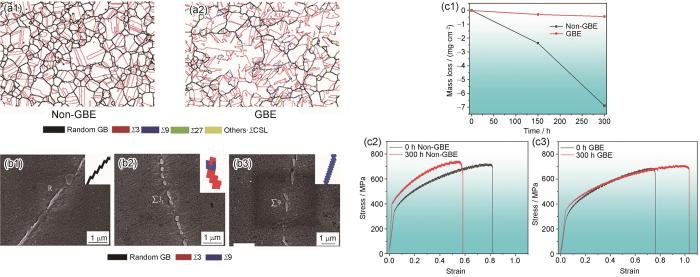
Grain boundary evolution before (a1) and after (a2) grain boundary engineering (GBE) treatment[25] (CSL—coincidence site lattice); SEM images and in situ orientation image microscopy (OIM) maps (insets) showing secondary carbide precipitation at random (R) grain boundaries (b1), Σ3 grain boundaries (b2), and Σ9 grain boundaries (b3)[25]; corrosion mass loss (c1) and high-temperature stress-strain curves of GH3535 alloy after corrosion in molten 45LiCl-55KCl salt for 300 h in the solid-solution state (c2) and GBE-treated state (c3)[70]
Table 5 Summary of typical coating systems, preparation processes, main process features, and applicable conditions[71-75]
Typical coating material system
Coating preparation method
Main process feature and applicable condition
Cr, Cr-Zr, Cr-Nb, Cr-Al
Physical vapor deposition (PVD)
Forms dense and uniform coatings with controllable thickness; suitable for complex geometries; limited deposition rate; coating adhesion depends on substrate pretreatment
Cr, Cr-Al, Cr-Ni, Cr-Fe
High power impulse magnetron sputtering (HiPIMS)
Produces dense, defect-free coatings with high ionization of sputtered species; excellent adhesion and microstructure uniformity; suitable for oxidation- and corrosion-resistant coatings on structural materials
Cr3C2, SiC, TiN
Chemical vapor deposition (CVD)
Enables good conformal coverage and high coating purity; applicable for diffusion barriers and high-temperature environments; requires high deposition temperature (700-1000 oC)
Ni, Ni-W, Ni-Mo
Electroplating/electrochemical deposition
Low-cost and scalable process; capable of producing uniform metallic coatings; limited by substrate conductivity and coating compactness; post-deposition annealing improves adhesion
Ni, Ni-Cr, Ni-Al, Fe-Cr-Al
Cold spray
Solid-state deposition with minimal oxidation; produces thick coatings with high bonding strength; suitable for large components and localized repair
Ni-Cr, Ni-Cr-Al, Ni-Mo
Laser cladding/surface melting
Achieves metallurgical bonding with substrate and gradient composition transition; effective for high-temperature oxidation protection; potential thermal stress and dilution at interface
Al2O3, SiO2, Y2O3
Sol-gel/dip coating
Simple and cost-effective; applicable to complex geometries; suitable for oxide protective films; poor adhesion under thermal cycling unless combined with interlayer
Characteristics of work hardened surface layer on austenitic stainless steels and its relation to SCC susceptibility in high temperature water
[A]. Proceedings of the 19th International Conference on Environmental Degradation of Materials in Nuclear Power Systems—Water Reactors [C]. Boston: American Nuclear Society, 2019: 165
Positive role of Y2O3 nanoparticles/matrix interface in enhancing corrosion and irradiation resistance of oxide dispersion-strengthened Ni-based alloys in molten salt environments
Technology road-map update for generation IV nuclear energy systems
1
2014
... 核能作为低碳基荷能源的重要支撑,其安全性、经济性和可持续发展已成为全球能源结构转型的关键议题.第四代核能系统以其固有安全特性、高燃料利用率和核废料最小化等优势,被视为应对全球能源与环境双重挑战的战略方向之一[1].其中,熔盐堆(molten salt reactor,MSR)作为代表性堆型,采用熔融盐作为燃料载体和冷却介质,具有负温度反馈系数、常压运作和在线燃料处理等技术特征[2],不仅在热效率和安全性方面表现优越,还可与钍基燃料循环深度结合,从而提高核燃料利用效率,并通过在线后处理技术降低长寿命核废料累积[3].因此,围绕熔盐堆开展的Th资源战略转化、液态燃料在线处理与先进核能系统自主化研究,已成为先进核能领域的重要技术方向. ...
Molten salt reactors: A new beginning for an old idea
1
2010
... 核能作为低碳基荷能源的重要支撑,其安全性、经济性和可持续发展已成为全球能源结构转型的关键议题.第四代核能系统以其固有安全特性、高燃料利用率和核废料最小化等优势,被视为应对全球能源与环境双重挑战的战略方向之一[1].其中,熔盐堆(molten salt reactor,MSR)作为代表性堆型,采用熔融盐作为燃料载体和冷却介质,具有负温度反馈系数、常压运作和在线燃料处理等技术特征[2],不仅在热效率和安全性方面表现优越,还可与钍基燃料循环深度结合,从而提高核燃料利用效率,并通过在线后处理技术降低长寿命核废料累积[3].因此,围绕熔盐堆开展的Th资源战略转化、液态燃料在线处理与先进核能系统自主化研究,已成为先进核能领域的重要技术方向. ...
1
2016
... 核能作为低碳基荷能源的重要支撑,其安全性、经济性和可持续发展已成为全球能源结构转型的关键议题.第四代核能系统以其固有安全特性、高燃料利用率和核废料最小化等优势,被视为应对全球能源与环境双重挑战的战略方向之一[1].其中,熔盐堆(molten salt reactor,MSR)作为代表性堆型,采用熔融盐作为燃料载体和冷却介质,具有负温度反馈系数、常压运作和在线燃料处理等技术特征[2],不仅在热效率和安全性方面表现优越,还可与钍基燃料循环深度结合,从而提高核燃料利用效率,并通过在线后处理技术降低长寿命核废料累积[3].因此,围绕熔盐堆开展的Th资源战略转化、液态燃料在线处理与先进核能系统自主化研究,已成为先进核能领域的重要技术方向. ...
The thorium molten salt reactor: Moving on from the MSBR
Corrosion and Te embrittlement behaviors of Ni-Mo-Cr-Nb alloy in Te-containing molten salts
4
2025
... 式中,M代表Li、K、Na、Be等常用元素.式(1)和(2)为氟盐水解反应的通式,后续热力学数据均以700 ℃为计算温度.水解反应产生的气态HF会迅速溶解在熔盐中,形成液态HF,显著加速活性元素溶解.Zheng等[10]使用HSC Chemistry 6.0软件计算了常见活性元素与熔盐组分的化学反应和700 ℃下反应的ΔG,如表1[10]所示.虽然不同团队采用的热力学计算软件有所差异,但得到的氟化物的ΔG排序基本一致,如图1[11~13]所示,反映出熔盐体系中元素活泼性的普适规律:在FLiNaK体系中,Li、Na、K、Be最易发生反应;而常见结构材料中Ni的惰性最强,Fe次之,Cr最易溶解;微合金元素的惰性顺序为Mo > W > Mn > Nb > Si > Al > Ti > Zr > B. ...
... [10]所示.虽然不同团队采用的热力学计算软件有所差异,但得到的氟化物的ΔG排序基本一致,如图1[11~13]所示,反映出熔盐体系中元素活泼性的普适规律:在FLiNaK体系中,Li、Na、K、Be最易发生反应;而常见结构材料中Ni的惰性最强,Fe次之,Cr最易溶解;微合金元素的惰性顺序为Mo > W > Mn > Nb > Si > Al > Ti > Zr > B. ...
... Summary of chemical reactions between common active elements and molten salt components and Gibbs free energy changes (ΔG) for reactions at 700 oC[10] ...
Investigation on the corrosion behavior of Hastelloy N and 316L stainless steel in LiF-NaF-KF molten salt
4
2015
... 式中,M代表Li、K、Na、Be等常用元素.式(1)和(2)为氟盐水解反应的通式,后续热力学数据均以700 ℃为计算温度.水解反应产生的气态HF会迅速溶解在熔盐中,形成液态HF,显著加速活性元素溶解.Zheng等[10]使用HSC Chemistry 6.0软件计算了常见活性元素与熔盐组分的化学反应和700 ℃下反应的ΔG,如表1[10]所示.虽然不同团队采用的热力学计算软件有所差异,但得到的氟化物的ΔG排序基本一致,如图1[11~13]所示,反映出熔盐体系中元素活泼性的普适规律:在FLiNaK体系中,Li、Na、K、Be最易发生反应;而常见结构材料中Ni的惰性最强,Fe次之,Cr最易溶解;微合金元素的惰性顺序为Mo > W > Mn > Nb > Si > Al > Ti > Zr > B. ...
... Summary of chemical reactions between common active elements and molten salt components and Gibbs free energy changes (ΔG) for reactions at 700 oC[10]Table 1
... 式中,M代表Li、K、Na、Be等常用元素.式(1)和(2)为氟盐水解反应的通式,后续热力学数据均以700 ℃为计算温度.水解反应产生的气态HF会迅速溶解在熔盐中,形成液态HF,显著加速活性元素溶解.Zheng等[10]使用HSC Chemistry 6.0软件计算了常见活性元素与熔盐组分的化学反应和700 ℃下反应的ΔG,如表1[10]所示.虽然不同团队采用的热力学计算软件有所差异,但得到的氟化物的ΔG排序基本一致,如图1[11~13]所示,反映出熔盐体系中元素活泼性的普适规律:在FLiNaK体系中,Li、Na、K、Be最易发生反应;而常见结构材料中Ni的惰性最强,Fe次之,Cr最易溶解;微合金元素的惰性顺序为Mo > W > Mn > Nb > Si > Al > Ti > Zr > B. ...
... Summary of chemical reactions between common active elements and molten salt components and Gibbs free energy changes (ΔG) for reactions at 700 oC[10]Table 1
Corrosion of structural materials in NaF-NaBF4 molten salt
5
2025
... 式中,M代表Li、K、Na、Be等常用元素.式(1)和(2)为氟盐水解反应的通式,后续热力学数据均以700 ℃为计算温度.水解反应产生的气态HF会迅速溶解在熔盐中,形成液态HF,显著加速活性元素溶解.Zheng等[10]使用HSC Chemistry 6.0软件计算了常见活性元素与熔盐组分的化学反应和700 ℃下反应的ΔG,如表1[10]所示.虽然不同团队采用的热力学计算软件有所差异,但得到的氟化物的ΔG排序基本一致,如图1[11~13]所示,反映出熔盐体系中元素活泼性的普适规律:在FLiNaK体系中,Li、Na、K、Be最易发生反应;而常见结构材料中Ni的惰性最强,Fe次之,Cr最易溶解;微合金元素的惰性顺序为Mo > W > Mn > Nb > Si > Al > Ti > Zr > B. ...
... Summary of chemical reactions between common active elements and molten salt components and Gibbs free energy changes (ΔG) for reactions at 700 oC[10]Table 1
... [14,15]Top surface and cross-sectional SEM images and corresponding elemental analyses of Ni<sub>80</sub>Cr<sub>20</sub>, 800H, and GH3535 alloys after corrosion in molten FLiNaK salt (a1-a3) top surface SEM image (a1) and corresponding EDS elemental mappings of Ni (a2) and Cr (a3) in Ni<sub>80</sub>Cr<sub>20</sub> alloy after 4.5 h corrosion at 600 <sup>o</sup>C<sup>[<xref ref-type="bibr" rid="R14">14</xref>]</sup> (b1-b3) local cross-sectional SEM image (b1) and corresponding EDS elemental mappings of Ni (b2) and Cr (b3) in Ni<sub>80</sub>Cr<sub>20 </sub>alloy after 4.5 h corrosion at 600 <sup>o</sup>C<sup>[<xref ref-type="bibr" rid="R14">14</xref>]</sup> (c1-c3) cross-sectional SEM image (c1) and EPMA images showing the elemental distributions of Cr (c2) and Ni (c3) in 800H alloy after 300 h corrosion at 850 <sup>o</sup>C<sup>[<xref ref-type="bibr" rid="R15">15</xref>]</sup> (d1-d3) cross-sectional SEM image (d1) and EPMA images showing the elemental distributions of Cr (d2) and Ni (d3) in GH3535 alloy after 300 h corrosion at 850 <sup>o</sup>C<sup>[<xref ref-type="bibr" rid="R15">15</xref>]</sup>Fig.2
... [14] (b1-b3) local cross-sectional SEM image (b1) and corresponding EDS elemental mappings of Ni (b2) and Cr (b3) in Ni80Cr20 alloy after 4.5 h corrosion at 600 oC[14] (c1-c3) cross-sectional SEM image (c1) and EPMA images showing the elemental distributions of Cr (c2) and Ni (c3) in 800H alloy after 300 h corrosion at 850 oC[15] (d1-d3) cross-sectional SEM image (d1) and EPMA images showing the elemental distributions of Cr (d2) and Ni (d3) in GH3535 alloy after 300 h corrosion at 850 oC[15]Fig.2
... [14] (c1-c3) cross-sectional SEM image (c1) and EPMA images showing the elemental distributions of Cr (c2) and Ni (c3) in 800H alloy after 300 h corrosion at 850 oC[15] (d1-d3) cross-sectional SEM image (d1) and EPMA images showing the elemental distributions of Cr (d2) and Ni (d3) in GH3535 alloy after 300 h corrosion at 850 oC[15]Fig.2
Top surface and cross-sectional SEM images and corresponding elemental analyses of Ni<sub>80</sub>Cr<sub>20</sub>, 800H, and GH3535 alloys after corrosion in molten FLiNaK salt (a1-a3) top surface SEM image (a1) and corresponding EDS elemental mappings of Ni (a2) and Cr (a3) in Ni<sub>80</sub>Cr<sub>20</sub> alloy after 4.5 h corrosion at 600 <sup>o</sup>C<sup>[<xref ref-type="bibr" rid="R14">14</xref>]</sup> (b1-b3) local cross-sectional SEM image (b1) and corresponding EDS elemental mappings of Ni (b2) and Cr (b3) in Ni<sub>80</sub>Cr<sub>20 </sub>alloy after 4.5 h corrosion at 600 <sup>o</sup>C<sup>[<xref ref-type="bibr" rid="R14">14</xref>]</sup> (c1-c3) cross-sectional SEM image (c1) and EPMA images showing the elemental distributions of Cr (c2) and Ni (c3) in 800H alloy after 300 h corrosion at 850 <sup>o</sup>C<sup>[<xref ref-type="bibr" rid="R15">15</xref>]</sup> (d1-d3) cross-sectional SEM image (d1) and EPMA images showing the elemental distributions of Cr (d2) and Ni (d3) in GH3535 alloy after 300 h corrosion at 850 <sup>o</sup>C<sup>[<xref ref-type="bibr" rid="R15">15</xref>]</sup>Fig.2
... [15] (d1-d3) cross-sectional SEM image (d1) and EPMA images showing the elemental distributions of Cr (d2) and Ni (d3) in GH3535 alloy after 300 h corrosion at 850 oC[15]Fig.2
... [23];Ni在含Te熔融盐中腐蚀后Te沿晶界向基体内部扩散的EPMA像和元素分布图[24];GH3535合金在700 ℃含Te的熔融FLiNaK盐中腐蚀1000 h后的截面形貌及EPMA元素面扫描分布图[26];含Te熔盐腐蚀前后304不锈钢[27]、GH3535合金[24]的室温拉伸曲线图及形貌BSE images and elemental line-scan profiles of alloy 625 after 48 h corrosion in molten FLiNaK salt containing 0.5%Te at 700 <sup>o</sup>C<sup>[<xref ref-type="bibr" rid="R23">23</xref>]</sup> (a), EPMA image and corresponding elemental map showing Te penetration along grain boundaries after corrosion in Te-containing molten salt<sup>[<xref ref-type="bibr" rid="R24">24</xref>]</sup> (b), cross-sectional morphology and EPMA elemental mappings of GH3535 alloy after 1000 h corrosion in molten FLiNaK salt containing Te at 700 <sup>o</sup>C<sup>[<xref ref-type="bibr" rid="R26">26</xref>]</sup> (Arrows show the carbides) (c), and room-temperature tensile curves and morphologies (insets) of 304 stainless steel<sup>[<xref ref-type="bibr" rid="R27">27</xref>]</sup> (w/o—without) (d1) and GH3535 alloy<sup>[<xref ref-type="bibr" rid="R24">24</xref>]</sup> (d2) before and after corrosion in Te-containing molten saltFig.3
... [23] (a), EPMA image and corresponding elemental map showing Te penetration along grain boundaries after corrosion in Te-containing molten salt[24] (b), cross-sectional morphology and EPMA elemental mappings of GH3535 alloy after 1000 h corrosion in molten FLiNaK salt containing Te at 700 oC[26] (Arrows show the carbides) (c), and room-temperature tensile curves and morphologies (insets) of 304 stainless steel[27] (w/o—without) (d1) and GH3535 alloy[24] (d2) before and after corrosion in Te-containing molten saltFig.3
... [24];GH3535合金在700 ℃含Te的熔融FLiNaK盐中腐蚀1000 h后的截面形貌及EPMA元素面扫描分布图[26];含Te熔盐腐蚀前后304不锈钢[27]、GH3535合金[24]的室温拉伸曲线图及形貌BSE images and elemental line-scan profiles of alloy 625 after 48 h corrosion in molten FLiNaK salt containing 0.5%Te at 700 <sup>o</sup>C<sup>[<xref ref-type="bibr" rid="R23">23</xref>]</sup> (a), EPMA image and corresponding elemental map showing Te penetration along grain boundaries after corrosion in Te-containing molten salt<sup>[<xref ref-type="bibr" rid="R24">24</xref>]</sup> (b), cross-sectional morphology and EPMA elemental mappings of GH3535 alloy after 1000 h corrosion in molten FLiNaK salt containing Te at 700 <sup>o</sup>C<sup>[<xref ref-type="bibr" rid="R26">26</xref>]</sup> (Arrows show the carbides) (c), and room-temperature tensile curves and morphologies (insets) of 304 stainless steel<sup>[<xref ref-type="bibr" rid="R27">27</xref>]</sup> (w/o—without) (d1) and GH3535 alloy<sup>[<xref ref-type="bibr" rid="R24">24</xref>]</sup> (d2) before and after corrosion in Te-containing molten saltFig.3
... [24]的室温拉伸曲线图及形貌BSE images and elemental line-scan profiles of alloy 625 after 48 h corrosion in molten FLiNaK salt containing 0.5%Te at 700 <sup>o</sup>C<sup>[<xref ref-type="bibr" rid="R23">23</xref>]</sup> (a), EPMA image and corresponding elemental map showing Te penetration along grain boundaries after corrosion in Te-containing molten salt<sup>[<xref ref-type="bibr" rid="R24">24</xref>]</sup> (b), cross-sectional morphology and EPMA elemental mappings of GH3535 alloy after 1000 h corrosion in molten FLiNaK salt containing Te at 700 <sup>o</sup>C<sup>[<xref ref-type="bibr" rid="R26">26</xref>]</sup> (Arrows show the carbides) (c), and room-temperature tensile curves and morphologies (insets) of 304 stainless steel<sup>[<xref ref-type="bibr" rid="R27">27</xref>]</sup> (w/o—without) (d1) and GH3535 alloy<sup>[<xref ref-type="bibr" rid="R24">24</xref>]</sup> (d2) before and after corrosion in Te-containing molten saltFig.3
... [24] (b), cross-sectional morphology and EPMA elemental mappings of GH3535 alloy after 1000 h corrosion in molten FLiNaK salt containing Te at 700 oC[26] (Arrows show the carbides) (c), and room-temperature tensile curves and morphologies (insets) of 304 stainless steel[27] (w/o—without) (d1) and GH3535 alloy[24] (d2) before and after corrosion in Te-containing molten saltFig.3
... [25],不同晶界上二次碳化物的析出形貌[25],及GBE调控后GH3535合金的腐蚀失重及力学性能变化[70]Grain boundary evolution before (a1) and after (a2) grain boundary engineering (GBE) treatment<sup>[<xref ref-type="bibr" rid="R25">25</xref>]</sup> (CSL—coincidence site lattice); SEM images and <i>in situ</i> orientation image microscopy (OIM) maps (insets) showing secondary carbide precipitation at random (R) grain boundaries (b1), <i>Σ</i>3 grain boundaries (b2), and <i>Σ</i>9 grain boundaries (b3)<sup>[<xref ref-type="bibr" rid="R25">25</xref>]</sup>; corrosion mass loss (c1) and high-temperature stress-strain curves of GH3535 alloy after corrosion in molten 45LiCl-55KCl salt for 300 h in the solid-solution state (c2) and GBE-treated state (c3)<sup>[<xref ref-type="bibr" rid="R70">70</xref>]</sup>Fig.73.3.1 阻断Te的沿晶扩散通道
... [25],及GBE调控后GH3535合金的腐蚀失重及力学性能变化[70]Grain boundary evolution before (a1) and after (a2) grain boundary engineering (GBE) treatment<sup>[<xref ref-type="bibr" rid="R25">25</xref>]</sup> (CSL—coincidence site lattice); SEM images and <i>in situ</i> orientation image microscopy (OIM) maps (insets) showing secondary carbide precipitation at random (R) grain boundaries (b1), <i>Σ</i>3 grain boundaries (b2), and <i>Σ</i>9 grain boundaries (b3)<sup>[<xref ref-type="bibr" rid="R25">25</xref>]</sup>; corrosion mass loss (c1) and high-temperature stress-strain curves of GH3535 alloy after corrosion in molten 45LiCl-55KCl salt for 300 h in the solid-solution state (c2) and GBE-treated state (c3)<sup>[<xref ref-type="bibr" rid="R70">70</xref>]</sup>Fig.73.3.1 阻断Te的沿晶扩散通道
... [25] (CSL—coincidence site lattice); SEM images and in situ orientation image microscopy (OIM) maps (insets) showing secondary carbide precipitation at random (R) grain boundaries (b1), Σ3 grain boundaries (b2), and Σ9 grain boundaries (b3)[25]; corrosion mass loss (c1) and high-temperature stress-strain curves of GH3535 alloy after corrosion in molten 45LiCl-55KCl salt for 300 h in the solid-solution state (c2) and GBE-treated state (c3)[70]Fig.73.3.1 阻断Te的沿晶扩散通道
... [25]; corrosion mass loss (c1) and high-temperature stress-strain curves of GH3535 alloy after corrosion in molten 45LiCl-55KCl salt for 300 h in the solid-solution state (c2) and GBE-treated state (c3)[70]Fig.73.3.1 阻断Te的沿晶扩散通道
... [25],不同晶界上二次碳化物的析出形貌[25],及GBE调控后GH3535合金的腐蚀失重及力学性能变化[70]Grain boundary evolution before (a1) and after (a2) grain boundary engineering (GBE) treatment<sup>[<xref ref-type="bibr" rid="R25">25</xref>]</sup> (CSL—coincidence site lattice); SEM images and <i>in situ</i> orientation image microscopy (OIM) maps (insets) showing secondary carbide precipitation at random (R) grain boundaries (b1), <i>Σ</i>3 grain boundaries (b2), and <i>Σ</i>9 grain boundaries (b3)<sup>[<xref ref-type="bibr" rid="R25">25</xref>]</sup>; corrosion mass loss (c1) and high-temperature stress-strain curves of GH3535 alloy after corrosion in molten 45LiCl-55KCl salt for 300 h in the solid-solution state (c2) and GBE-treated state (c3)<sup>[<xref ref-type="bibr" rid="R70">70</xref>]</sup>Fig.73.3.1 阻断Te的沿晶扩散通道
... [25],及GBE调控后GH3535合金的腐蚀失重及力学性能变化[70]Grain boundary evolution before (a1) and after (a2) grain boundary engineering (GBE) treatment<sup>[<xref ref-type="bibr" rid="R25">25</xref>]</sup> (CSL—coincidence site lattice); SEM images and <i>in situ</i> orientation image microscopy (OIM) maps (insets) showing secondary carbide precipitation at random (R) grain boundaries (b1), <i>Σ</i>3 grain boundaries (b2), and <i>Σ</i>9 grain boundaries (b3)<sup>[<xref ref-type="bibr" rid="R25">25</xref>]</sup>; corrosion mass loss (c1) and high-temperature stress-strain curves of GH3535 alloy after corrosion in molten 45LiCl-55KCl salt for 300 h in the solid-solution state (c2) and GBE-treated state (c3)<sup>[<xref ref-type="bibr" rid="R70">70</xref>]</sup>Fig.73.3.1 阻断Te的沿晶扩散通道
... [25] (CSL—coincidence site lattice); SEM images and in situ orientation image microscopy (OIM) maps (insets) showing secondary carbide precipitation at random (R) grain boundaries (b1), Σ3 grain boundaries (b2), and Σ9 grain boundaries (b3)[25]; corrosion mass loss (c1) and high-temperature stress-strain curves of GH3535 alloy after corrosion in molten 45LiCl-55KCl salt for 300 h in the solid-solution state (c2) and GBE-treated state (c3)[70]Fig.73.3.1 阻断Te的沿晶扩散通道
... [25]; corrosion mass loss (c1) and high-temperature stress-strain curves of GH3535 alloy after corrosion in molten 45LiCl-55KCl salt for 300 h in the solid-solution state (c2) and GBE-treated state (c3)[70]Fig.73.3.1 阻断Te的沿晶扩散通道
BSE images and elemental line-scan profiles of alloy 625 after 48 h corrosion in molten FLiNaK salt containing 0.5%Te at 700 <sup>o</sup>C<sup>[<xref ref-type="bibr" rid="R23">23</xref>]</sup> (a), EPMA image and corresponding elemental map showing Te penetration along grain boundaries after corrosion in Te-containing molten salt<sup>[<xref ref-type="bibr" rid="R24">24</xref>]</sup> (b), cross-sectional morphology and EPMA elemental mappings of GH3535 alloy after 1000 h corrosion in molten FLiNaK salt containing Te at 700 <sup>o</sup>C<sup>[<xref ref-type="bibr" rid="R26">26</xref>]</sup> (Arrows show the carbides) (c), and room-temperature tensile curves and morphologies (insets) of 304 stainless steel<sup>[<xref ref-type="bibr" rid="R27">27</xref>]</sup> (w/o—without) (d1) and GH3535 alloy<sup>[<xref ref-type="bibr" rid="R24">24</xref>]</sup> (d2) before and after corrosion in Te-containing molten saltFig.3
... [26] (Arrows show the carbides) (c), and room-temperature tensile curves and morphologies (insets) of 304 stainless steel[27] (w/o—without) (d1) and GH3535 alloy[24] (d2) before and after corrosion in Te-containing molten saltFig.3
BSE images and elemental line-scan profiles of alloy 625 after 48 h corrosion in molten FLiNaK salt containing 0.5%Te at 700 <sup>o</sup>C<sup>[<xref ref-type="bibr" rid="R23">23</xref>]</sup> (a), EPMA image and corresponding elemental map showing Te penetration along grain boundaries after corrosion in Te-containing molten salt<sup>[<xref ref-type="bibr" rid="R24">24</xref>]</sup> (b), cross-sectional morphology and EPMA elemental mappings of GH3535 alloy after 1000 h corrosion in molten FLiNaK salt containing Te at 700 <sup>o</sup>C<sup>[<xref ref-type="bibr" rid="R26">26</xref>]</sup> (Arrows show the carbides) (c), and room-temperature tensile curves and morphologies (insets) of 304 stainless steel<sup>[<xref ref-type="bibr" rid="R27">27</xref>]</sup> (w/o—without) (d1) and GH3535 alloy<sup>[<xref ref-type="bibr" rid="R24">24</xref>]</sup> (d2) before and after corrosion in Te-containing molten saltFig.3
(a) cross-sectional morphologies of stress-free sample and creep sample after corrosion in molten salt at 565 oC for 830 and 1068 h ...
... (c) schematics of stress corrosion cracking mechanism (GB—grain boundary)Corrosion-induced cracking behaviors of 316L stainless steel under applied stress and the schematics of the stress corrosion cracking mechanism<sup>[<xref ref-type="bibr" rid="R31">31</xref>]</sup>Fig.4
... [60,62,64]Mechanisms of the secondary phase/matrix interface in enhancing corrosion and irradiation resistances<sup>[<xref ref-type="bibr" rid="R60">60</xref>,<xref ref-type="bibr" rid="R62">62</xref>,<xref ref-type="bibr" rid="R64">64</xref>]</sup> (a1, a2) Cr adsorption and diffusion blocking (Fig.6a2 shows the Cr-rich shell around the particle marked by the circle in Fig.6a1)<sup>[<xref ref-type="bibr" rid="R60">60</xref>]</sup> (b) helium bubble suppression<sup>[<xref ref-type="bibr" rid="R64">64</xref>]</sup> (c1, c2) microstructures of NiMoCr-oxide dispersion strengthened (ODS) alloy after irradiation and molten salt exposure at different magnifications (Yellow circles mark grain boundary areas, and red circles indicate matrix regions)<sup>[<xref ref-type="bibr" rid="R62">62</xref>]</sup>Fig.63.2.2 辐照缺陷捕获与He泡抑制
... [60,62,64] (a1, a2) Cr adsorption and diffusion blocking (Fig.6a2 shows the Cr-rich shell around the particle marked by the circle in Fig.6a1)[60] (b) helium bubble suppression[64] (c1, c2) microstructures of NiMoCr-oxide dispersion strengthened (ODS) alloy after irradiation and molten salt exposure at different magnifications (Yellow circles mark grain boundary areas, and red circles indicate matrix regions)[62]Fig.63.2.2 辐照缺陷捕获与He泡抑制
... [60] (b) helium bubble suppression[64] (c1, c2) microstructures of NiMoCr-oxide dispersion strengthened (ODS) alloy after irradiation and molten salt exposure at different magnifications (Yellow circles mark grain boundary areas, and red circles indicate matrix regions)[62]Fig.63.2.2 辐照缺陷捕获与He泡抑制
Positive role of Y2O3 nanoparticles/matrix interface in enhancing corrosion and irradiation resistance of oxide dispersion-strengthened Ni-based alloys in molten salt environments
... ,62,64]Mechanisms of the secondary phase/matrix interface in enhancing corrosion and irradiation resistances<sup>[<xref ref-type="bibr" rid="R60">60</xref>,<xref ref-type="bibr" rid="R62">62</xref>,<xref ref-type="bibr" rid="R64">64</xref>]</sup> (a1, a2) Cr adsorption and diffusion blocking (Fig.6a2 shows the Cr-rich shell around the particle marked by the circle in Fig.6a1)<sup>[<xref ref-type="bibr" rid="R60">60</xref>]</sup> (b) helium bubble suppression<sup>[<xref ref-type="bibr" rid="R64">64</xref>]</sup> (c1, c2) microstructures of NiMoCr-oxide dispersion strengthened (ODS) alloy after irradiation and molten salt exposure at different magnifications (Yellow circles mark grain boundary areas, and red circles indicate matrix regions)<sup>[<xref ref-type="bibr" rid="R62">62</xref>]</sup>Fig.63.2.2 辐照缺陷捕获与He泡抑制
... ,62,64] (a1, a2) Cr adsorption and diffusion blocking (Fig.6a2 shows the Cr-rich shell around the particle marked by the circle in Fig.6a1)[60] (b) helium bubble suppression[64] (c1, c2) microstructures of NiMoCr-oxide dispersion strengthened (ODS) alloy after irradiation and molten salt exposure at different magnifications (Yellow circles mark grain boundary areas, and red circles indicate matrix regions)[62]Fig.63.2.2 辐照缺陷捕获与He泡抑制
... ,64]Mechanisms of the secondary phase/matrix interface in enhancing corrosion and irradiation resistances<sup>[<xref ref-type="bibr" rid="R60">60</xref>,<xref ref-type="bibr" rid="R62">62</xref>,<xref ref-type="bibr" rid="R64">64</xref>]</sup> (a1, a2) Cr adsorption and diffusion blocking (Fig.6a2 shows the Cr-rich shell around the particle marked by the circle in Fig.6a1)<sup>[<xref ref-type="bibr" rid="R60">60</xref>]</sup> (b) helium bubble suppression<sup>[<xref ref-type="bibr" rid="R64">64</xref>]</sup> (c1, c2) microstructures of NiMoCr-oxide dispersion strengthened (ODS) alloy after irradiation and molten salt exposure at different magnifications (Yellow circles mark grain boundary areas, and red circles indicate matrix regions)<sup>[<xref ref-type="bibr" rid="R62">62</xref>]</sup>Fig.63.2.2 辐照缺陷捕获与He泡抑制
... ,64] (a1, a2) Cr adsorption and diffusion blocking (Fig.6a2 shows the Cr-rich shell around the particle marked by the circle in Fig.6a1)[60] (b) helium bubble suppression[64] (c1, c2) microstructures of NiMoCr-oxide dispersion strengthened (ODS) alloy after irradiation and molten salt exposure at different magnifications (Yellow circles mark grain boundary areas, and red circles indicate matrix regions)[62]Fig.63.2.2 辐照缺陷捕获与He泡抑制
... [64] (c1, c2) microstructures of NiMoCr-oxide dispersion strengthened (ODS) alloy after irradiation and molten salt exposure at different magnifications (Yellow circles mark grain boundary areas, and red circles indicate matrix regions)[62]Fig.63.2.2 辐照缺陷捕获与He泡抑制
Grain boundary evolution before (a1) and after (a2) grain boundary engineering (GBE) treatment<sup>[<xref ref-type="bibr" rid="R25">25</xref>]</sup> (CSL—coincidence site lattice); SEM images and <i>in situ</i> orientation image microscopy (OIM) maps (insets) showing secondary carbide precipitation at random (R) grain boundaries (b1), <i>Σ</i>3 grain boundaries (b2), and <i>Σ</i>9 grain boundaries (b3)<sup>[<xref ref-type="bibr" rid="R25">25</xref>]</sup>; corrosion mass loss (c1) and high-temperature stress-strain curves of GH3535 alloy after corrosion in molten 45LiCl-55KCl salt for 300 h in the solid-solution state (c2) and GBE-treated state (c3)<sup>[<xref ref-type="bibr" rid="R70">70</xref>]</sup>Fig.73.3.1 阻断Te的沿晶扩散通道