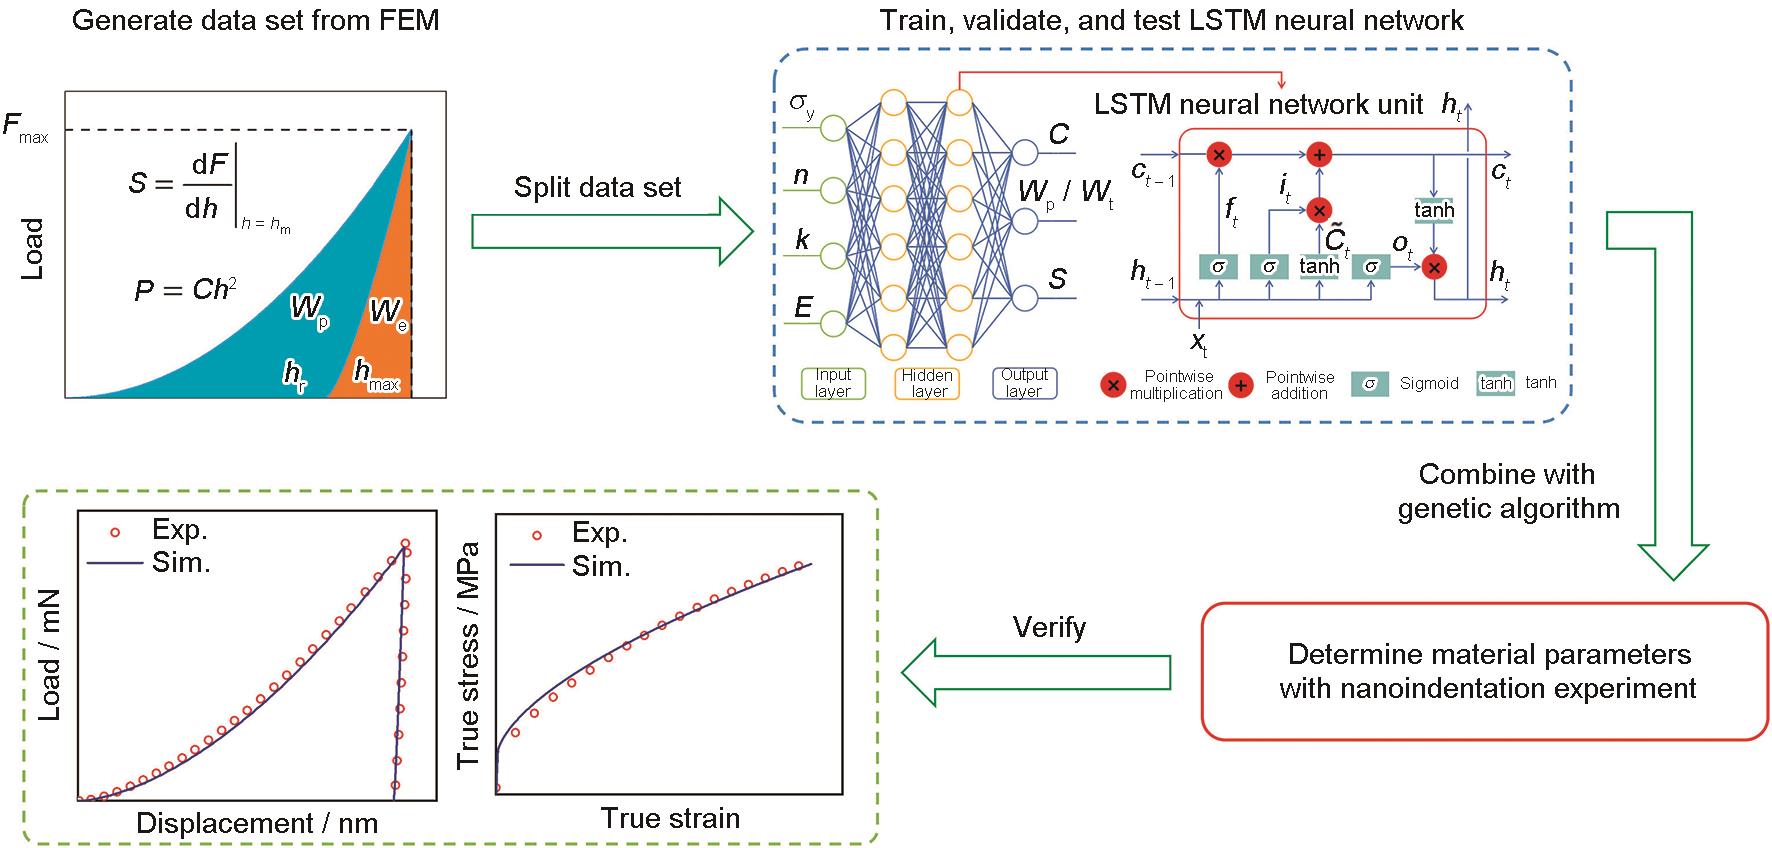
Fig.6. Flowchart of inverse analysis for determining material parameters based on nanoindentation experiments[72] (Finite element method (FEM) simulations generate nanoindentation load-displacement (F-h) data, where F is the indentation load and h is the indentation depth; Fmax and hmax denote the maximum load and maximum indentation depth, respectively; and hr is the residual indentation depth. The loading curvature C is defined by P = Ch2, and the unloading stiffness S is defined as S = dF / dh. Wp, We, and Wt represent the plastic work, elastic work, and total indentation work, respectively. The LSTM architecture includes a forget gate ft, an input gate it, and an output gate ot, which govern the updates of the current input xt, the cell state ct, and hidden state ht at time step t. Here, denotes the candidate cell state. The LSTM model maps the material parameters, including Young's modulus E, yield stress σy, strain-hardening exponent n, and hardening coefficient k, to the nanoindentation features C, Wp / Wt, and S. The identified parameters are validated by comparing simulated and experimental load-displacement and true stress-true strain responses)
|
 ), 张旭, 胡冰晖, 双思垚, 于峻石, 熊宇凯, 宋世杰