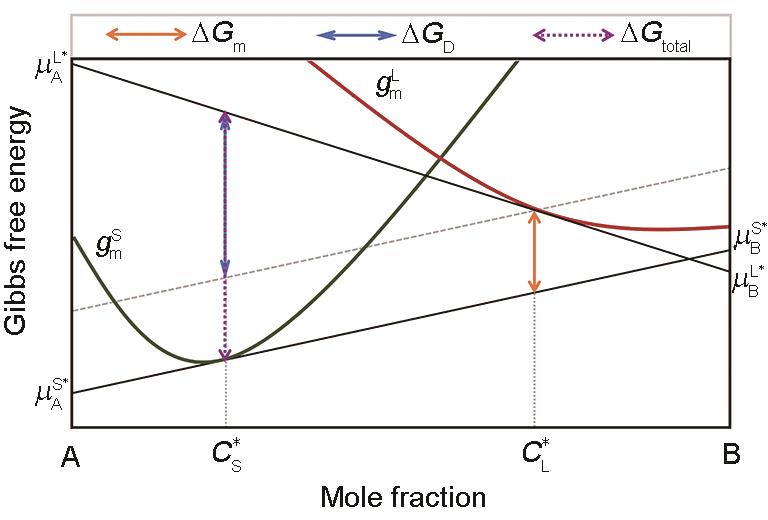
Fig.3 Mole Gibbs free energy diagram for the solid/liquid interface kinetic processes under a steady-state condition (Green and red curves represent the Gibbs free energy curve of the solid phase and liquid phase, respectively, the same below. Total Gibbs free energy dissipated by the interface after solidification of 1 mol liquid is = . By translating the tangent of Gibbs free energy curve of solid at to the Gibbs free energy curve of liquid at , is divided into two parts: The upper one for trans-interface diffusion is = and latter part for interface migration is = . —Gibbs free energy of interface migration, —Gibbs free energy of trans-interface diffusion, —the solid composition at the interface, —the liquid composition at the interface, —the chemical potential of A across the interface, —the chemical potential of B across the interface, and —the chemical potential at the interface for liquid and solid phase B, and —the chemical potential at the interface for liquid and solid phase B, respectively, —the mole Gibbs free energy of the solid, —the mole Gibbs free energy of the liquid)
|