机器学习势在铁电材料研究中的应用
Application of Machine Learning Force Fields for Modeling Ferroelectric Materials
机器学习势在铁电材料研究中的应用 |
| 刘仕, 黄佳玮, 武静 |
|
Application of Machine Learning Force Fields for Modeling Ferroelectric Materials |
| LIU Shi, HUANG Jiawei, WU Jing |
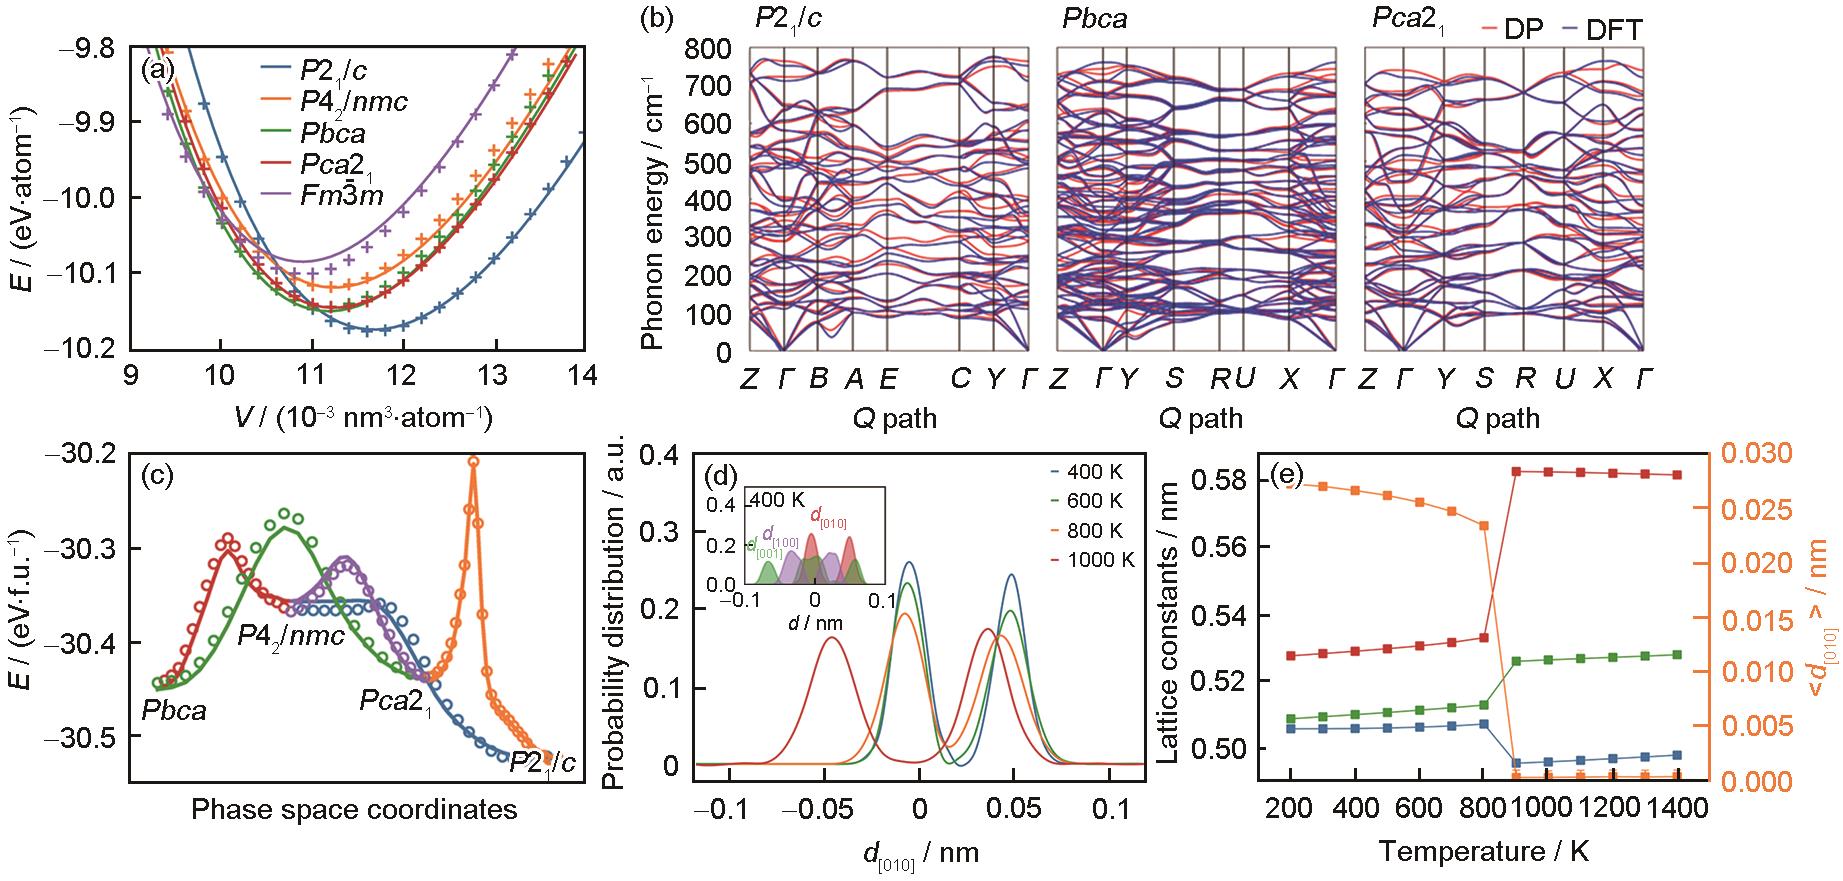
| 图5 HfO2不同晶相的状态方程[ |
| Fig.5 Equation of state for different crystalline phases of HfO2 (V is the volume of the cell. Solid lines and crosses mark the results of DFT calculations and DP model predictions, respectively)[ |
|
|