基于热力学计算与机器学习的增材制造镍基高温合金裂纹敏感性预测模型
Modeling of Crack Susceptibility of Ni-Based Superalloy for Additive Manufacturing via Thermodynamic Calculation and Machine Learning
基于热力学计算与机器学习的增材制造镍基高温合金裂纹敏感性预测模型 |
| 穆亚航, 张雪, 陈梓名, 孙晓峰, 梁静静, 李金国, 周亦胄 |
|
Modeling of Crack Susceptibility of Ni-Based Superalloy for Additive Manufacturing via Thermodynamic Calculation and Machine Learning |
| MU Yahang, ZHANG Xue, CHEN Ziming, SUN Xiaofeng, LIANG Jingjing, LI Jinguo, ZHOU Yizhou |
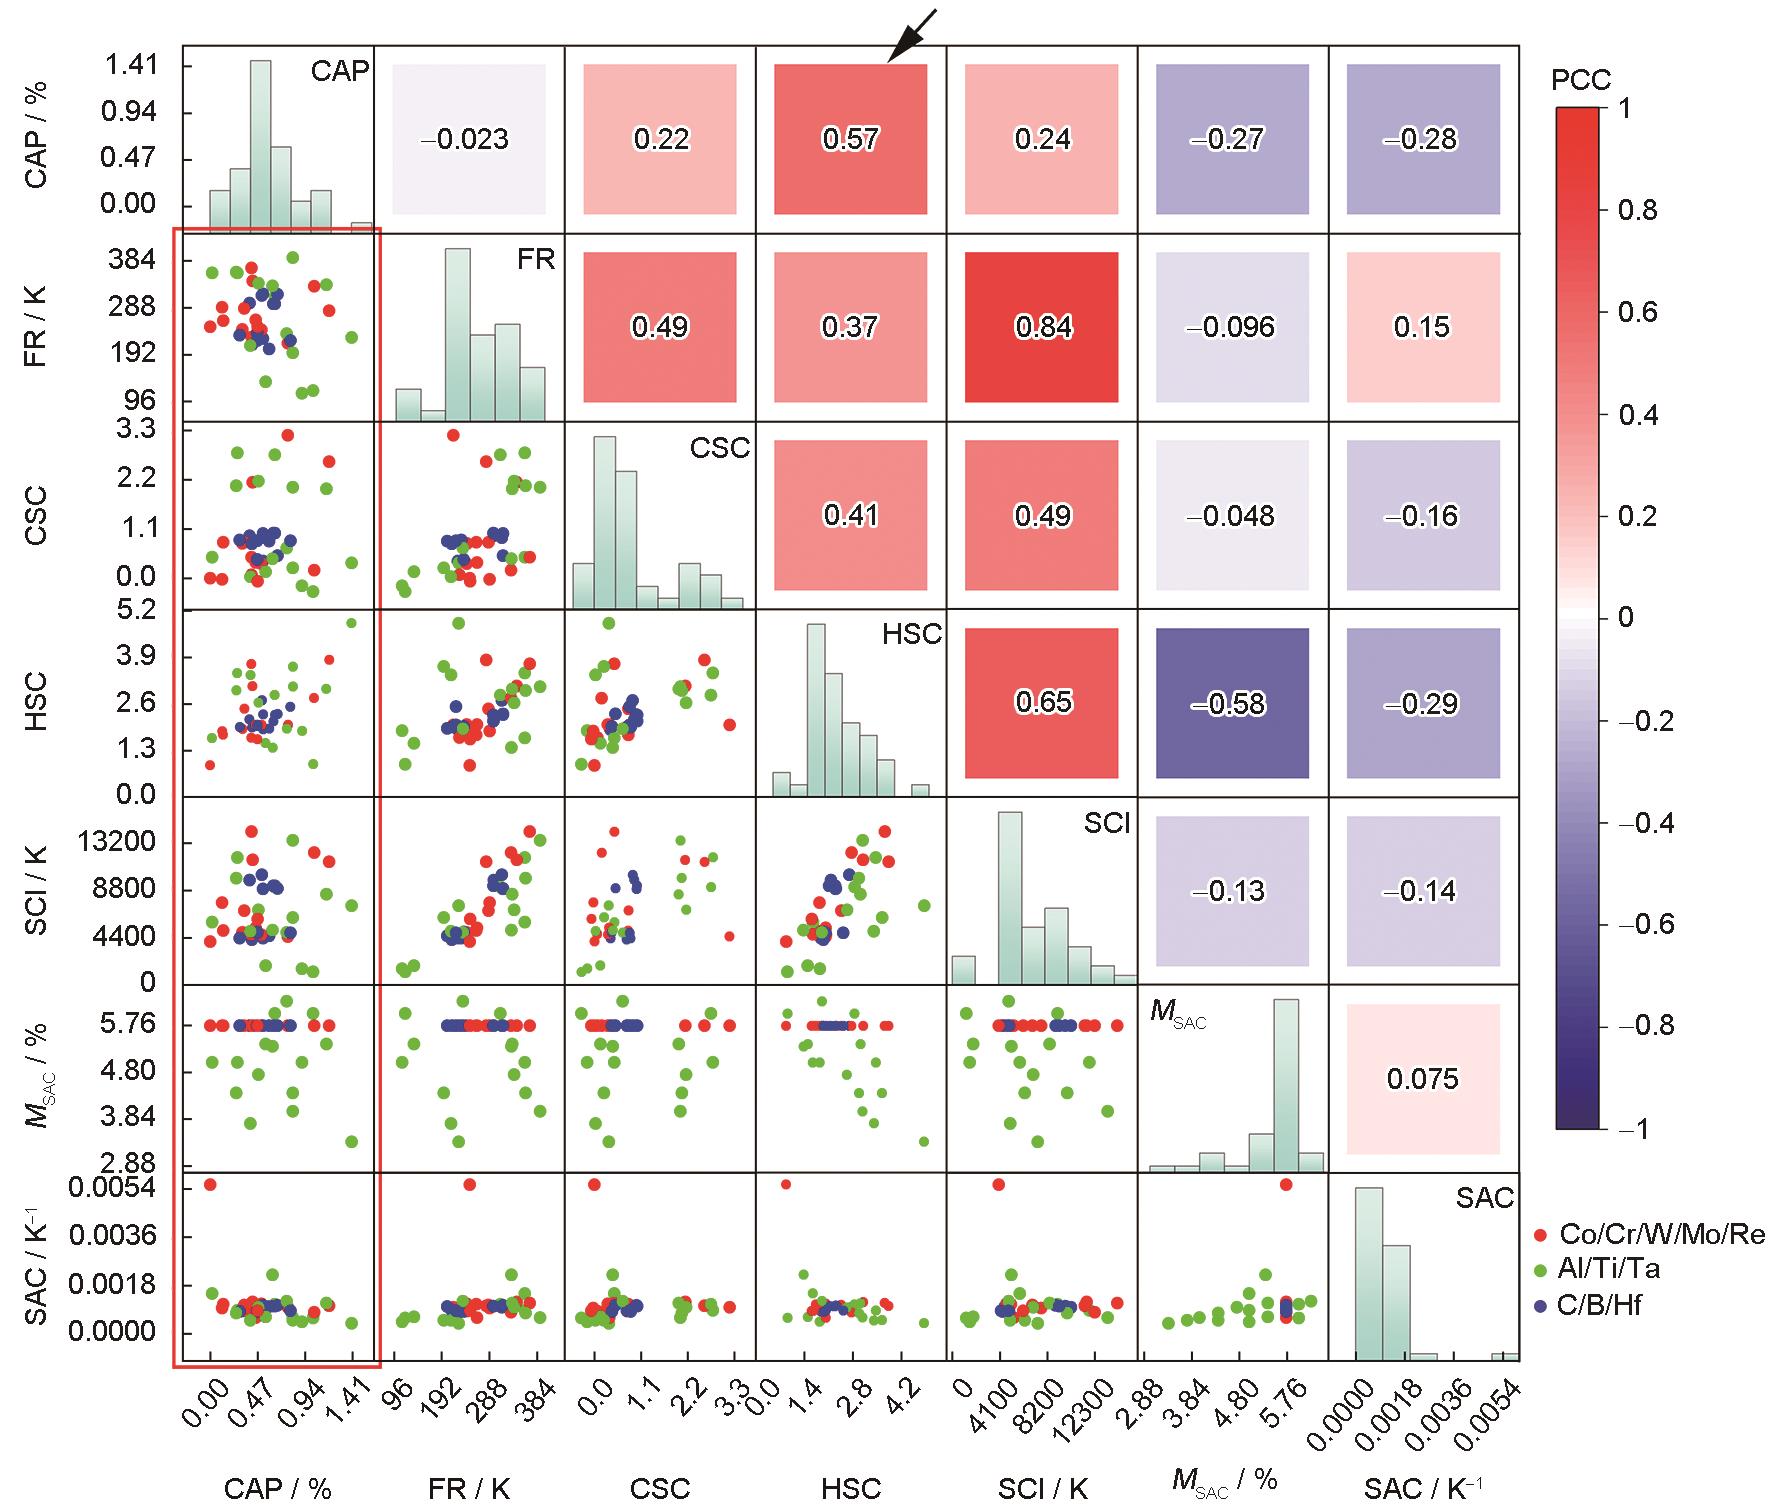
| 图4 各裂纹敏感性系数与裂纹面积分数的关系图 |
| Fig.4 Sactterplot matrix and Pearson correlation map of crack area percentage and crack susceptibility criteria (The lower triangular matrix is scatterplot matrix between each pair of variables, the diagonal is the frequency distribution histogram of each variable, and the upper triangular matrix is Pearson correlation map. The red frame line part represents the scatter plot of CAP and crack sensitivity, and the arrow refers to the crack susceptibility criterion with the highest correlation with CAP. Red, green, and blue dots represent the alloys that only change the solid solution elements, the γ′ forming elements, and trace elements, respectively. CAP—crack area percentage, PCC—Pearson correlation coefficient) |
|
|